Basecamp is a well-known project management tool that is favored by many teams for its ability to enhance collaboration and streamline workflows. It provides a suite of features, including task management, message boards, schedules and document storage, all within a user-friendly interface. However, it may not cater to everyone’s needs, as some teams might require more advanced features like Gantt charts or workload views, which Basecamp lacks. Others might prefer a per-user pricing model or a tool tailored to their industry. As a result, we’ve come up with a list of six top Basecamp alternatives.
Jump to:
Top Basecamp competitors and alternatives: Comparison
Before we delve into the comparison table, it’s worth noting that all the project management tools listed here, including Basecamp, offer essential features such as task management, advanced reporting and file sharing. These are fundamental parts of all the Basecamp alternatives we’re discussing.
Software
Native time tracking
Customizable workflows
Gantt charts
Built-in automation
Starting price (per user)
Basecamp
No
No
No
No
$15/month
Monday.com
No
Yes
Yes
Yes
$8/month
Jira
No
Yes
Yes
Yes
$7.75/month
ClickUp
Yes
Yes
Yes
Yes
$5/month
Wrike
Yes
Yes
Yes
Yes
$9.80/month
Teamwork
Yes
Yes
Yes
Yes
$5.99/month
Asana
Yes
Yes
Yes
Yes
$10.99/month
monday: Best for visual project management
Image: monday.com
monday.com is a versatile project management platform that stands out for its highly visual and intuitive interface. It offers a variety of views, including Kanban, Gantt and timeline views, making it a flexible tool for different types of project management. This adaptability, coupled with a robust set of features, makes monday.com a great alternative to Basecamp, especially for teams that value visual project management.
Figure A: Time-tracking dashboard on monday.com
Features
Customizable workflows that adapt to your team’s needs.
Time tracking (Figure A) to keep tabs on productivity.
Automation and integrations to streamline processes and ensure your different tools work together seamlessly.
Advanced reporting for data-driven decision-making.
Pros
Highly visual and intuitive, making project management more engaging.
Versatile, with different views to suit various project management styles.
Strong integration capabilities to connect with other tools your team uses.
Cons
Can be overwhelming for new users due to the wide array of features.
Higher price point compared to some alternatives, which might be a consideration for budget-conscious teams.
Pricing
In addition to its free plan, monday.com offers four pricing tiers: Basic, Standard, Pro and Enterprise. The Basic plan starts at $8 per user per month, while the Standard and Pro plans cost $10 and $16 per user per month when billed annually, respectively. Contact monday for Enterprise pricing information.
For more information, read the full monday review.
Jira: Best for software development teams
Image: Jira
Jira by Atlassian is a project management tool specifically designed with software development teams in mind. It offers agile functionality, including Scrum and Kanban boards and deep integration with other Atlassian products. Software teams in particular will find Jira an attractive alternative to Basecamp, especially due to its robust feature set and standout agile features.
Figure B: Scrum board in Jira for an Agile project
Features
Agile development features to support Scrum (Figure B) and Kanban methodologies.
Customizable workflows to fit your team’s development process.
Deep integration with developer tools like Bitbucket, Confluence and CI/CD tools like Jenkins.
Advanced reporting and analytics to track progress and performance.
Pros
Robust features for software development, catering specifically to developers’ needs.
Deep integration capabilities with other Atlassian products for a unified toolset.
Scalable for large teams, making it suitable for growing organizations.
Cons
Steeper learning curve due to its focus on software development.
Can be overkill for non-software projects, making it less suitable for general project management.
Pricing
Jira provides a free plan for up to 10 users. For larger teams, when billed monthly, the Standard plan costs $7.75 per user per month, and the Premium plan is $15.25 per user per month. It also offers an Enterprise plan that’s billed annually, and pricing is available on request.
For more information, read the full Jira review.
ClickUp: Best for all-in-one project management
Image: ClickUp
ClickUp aims to be a one-stop solution for all project management needs. It offers a wide range of features, including task management, time tracking, goal setting and even docs and notes functionality. If your team would be well-suited to an all-in-one project management solution, then ClickUp’s comprehensive approach would make it a strong alternative to Basecamp.
Figure C: ClickUp list view, one of many views offered
Features
Comprehensive task management to keep all your tasks in one place.
Time tracking and goal setting to keep your team focused and productive.
Docs and notes functionality to centralize your team’s knowledge.
Multiple customizable views (Figure C) to adapt to your team’s workflow.
Pros
All-in-one solution, reducing the need for multiple tools.
Customizable for different needs, making it adaptable to various workflows.
Competitive pricing, offering a balance between cost and features.
Cons
Can be overwhelming with so many features, which might require some time to fully explore.
Interface can be cluttered due to the vast array of features, which might affect usability.
Pricing
ClickUp offers a free plan with 100 MB of storage. For more storage and features, its Unlimited plan is available at $5 per user per month, Business plan at $12 per user per month and Business Plus at $19 per user per month, all billed annually. Its Enterprise plan’s pricing is available on request.
For more information, read the full ClickUp review.
Wrike: Best for enterprise teams
Image: Wrike
Wrike is a comprehensive project management tool designed with large teams and enterprises in mind. It offers robust features, including Gantt charts, workload view and custom dashboards. Wrike’s focus on enterprise-level project management, coupled with its scalability and strong security measures, makes it a compelling alternative to Basecamp for larger organizations.
Figure D: Gantt chart in Wrike
Features
Gantt charts (Figure D) and workload view to visualize project timelines and resources.
Custom dashboards and reports for personalized data visualization and insights.
Time tracking to monitor team productivity.
Advanced integration capabilities to connect with your existing software ecosystem.
Pros
Robust features for large teams, catering to complex project management needs.
Scalable for large enterprises, making it suitable for growing organizations.
Strong security measures to protect your project data.
Cons
Can be complex to set up due to its extensive feature set.
Higher price point, which might be a consideration for budget-conscious teams.
Pricing
In addition to a free plan, Wrike’s paid plans include the Team plan at $9.80 per user per month, billed annually, a Business plan at $24.80 per user per month, billed annually and an Enterprise plan with pricing available on request.
For more information, read the full Wrike review.
Teamwork: Best for client project management
Image: Teamwork
Teamwork is a project management tool that shines when it comes to client project management. It offers features like client permissions, invoicing and a client portal. This focus on client work, coupled with its user-friendly interface and strong customer support, makes Teamwork a worthy alternative to Basecamp for teams that frequently collaborate with clients.
Figure E: Time-tracking in Teamwork
Features
Client permissions and portal to facilitate client collaboration.
Offers invoicing features to streamline billing processes.
Task management and time tracking (Figure E) to keep your team on track.
Delivers Gantt charts for visual project planning.
Pros
Strong features for client work, enhancing client collaboration.
User-friendly interface, making it easy for your team and clients to use.
Its feature set makes it more than suitable for remote teams.
Cons
Limited integration capabilities, which might require workarounds for some workflows.
Some features are only available in the higher-tier plans, which might limit functionality for teams on a budget.
Pricing
Aside from a free plan, Teamwork offers the Starter plan at $5.99 per user per month, followed by the Deliver plan at $10 per user per month and the Grow plan at $18 per user per month, all billed annually. The Scale plan, however, requires you to request pricing information from Teamwork.
For more information, read the full Teamwork review.
Asana: Best for task management
Image: Asana
Asana is a project management tool that stands out for its comprehensive task management. It offers a simple, user-friendly interface and a wide range of task management features. This focus on task management, combined with its user-friendly interface and good free plan, makes Asana a strong alternative to Basecamp for teams that prioritize task management.
Figure F: Kanban board view in Asana
Features
Comprehensive task management to keep all your tasks organized.
Multiple views such as board (Figure F), timeline and calendar views to visualize your project from multiple perspectives.
Automation and integrations to streamline your workflows.
Advanced reporting for data-driven decision-making.
Pros
It is easy to manage and track tasks thanks to its standout task management features.
User-friendly interface, making it easy for your team to use.
Good free plan, making it accessible for teams on a budget.
Cons
Limited features in the free plan, which might require an upgrade for more functionality.
Can get expensive for larger teams, which might be unideal for budget-conscious organizations.
Pricing
Asana provides a free Basic plan for individuals and very small teams. For more features, the Premium plan is $10.99 per user per month if billed annually. It also offers a Business plan at $24.99 per user per month if billed annually and an Enterprise plan with advanced features and controls, with pricing available on request.
For more information, read the full Asana review.
Is Basecamp worth it?
Yes! I found value in Basecamp as a project management tool, though it’s worth noting that it was for a simple project management use case. Its strength lies in its simplicity and ease of use. It offers a clean, intuitive interface that made it easy for me to get started without a steep learning curve. The tool’s core features, such as task management, message boards and schedules, among others, are straightforward and effective, making it a solid choice for teams looking to streamline their workflow and enhance collaboration.
However, it’s also important to consider what Basecamp doesn’t offer. While its simplicity is a strength, it can also be a limitation for teams that require more advanced features. For instance, Basecamp does not offer Gantt charts, a feature that many project managers rely on for visualizing project timelines. It also lacks certain customization options that some teams might find necessary.
In terms of pricing, Basecamp’s flat rate pricing makes it clear and predictable and having only two tiers of $15 and $99 per user per month makes pricing quite straightforward. But it’s worth noting that the $15 tier is slightly higher than most of the lowest pricing tiers of the alternatives covered.
Basecamp pros and cons
Basecamp offers a balance between simplicity and functionality. It’s a tool that is easy to use and offers a range of features designed to improve team collaboration and project management. However, like any tool, it has its strengths and weaknesses and what works well for one team might not be as effective for another. Here’s a summary of the main pros and cons of Basecamp:
Pros
User-friendly interface makes it easy for teams to get started and intuitively use it.
Flat pricing model can be cost-effective for individuals, freelancers and larger teams.
Strong collaboration features like message boards and document storage.
Cons
Lacks certain advanced features like Gantt charts.
Flat rate might be limiting for users seeking more flexible pricing.
Limited customization options compared to some alternatives.
Basecamp pricing
Basecamp offers two pricing tiers: Basecamp and Basecamp Pro Unlimited.
Basecamp
This tier is perfect for freelancers, startups and small teams. It provides 500 GB of file and document storage and operates on a monthly, pay-as-you-go basis. The cost is $15 per user per month. Since Basecamp only bills its subscribers for employees, you can invite guests for free.
Basecamp Pro Unlimited
Larger teams and teams looking to scale will find this tier to be more attractive than the previous tier as it offers additional features like 5 TB of file and document storage, round-the-clock priority support and the Admin Pro Pack for much more control of access and permissions. It costs a flat rate of $299/month if billed annually and does not charge per user. This means your whole team can use Basecamp Pro Unlimited for a single set price. However, should you want to subscribe to the month-to-month plan, it will cost you $349 every month.
Do you need a Basecamp alternative?
Whether you need an alternative to Basecamp depends on your specific needs and circumstances. If you’re looking for more advanced features, more customization options or a pricing model that appeals to you more, then one of the alternatives listed above may be a better fit for you.
For instance, if you’re a software development team, you might prefer Jira for its robust agile development features. If you’re a freelancer or a small team on a budget, you might find ClickUp or Asana’s free plans more appealing. If you’re a larger enterprise with complex project management needs, Wrike’s robust features and scalability might be more suitable.
Methodology
To deliver an unbiased comparison of the tools listed above, we created a shortlist of tools that cater to different types of teams and then compared their features, strengths and weaknesses. We then used verified user reviews and a hands-on feel for most of the tools to augment our findings and gauge user feedback for the products.
Featured partners
1
Wrike
Visit website
Tackle complex projects with Wrike’s award-winning project management software. Break projects into simple steps, assign tasks to team members, and visualize progress with Gantt charts, Kanban boards, and calendars. Manage resource allocation and forecasting with software that’s easy to launch. Automation and AI features strip away time-consuming admin tasks so you can do the best work of your life. Streamline your practices, align your team, and ensure you hit deadlines and stay on budget.
Learn more about Wrike
2
monday.com
Visit website
monday.com Work OS is the project management software that helps you and your team plan, execute, and track projects and workflows in one collaborative space. Manage everything from simple to complex projects more efficiently with the help of visual boards, 200+ ready-made templates, clever no-code automations, and easy integrations. In addition, custom dashboards simplify reporting, so you can evaluate your progress and make data-driven decisions.
Learn more about monday.com
3
Smartsheet
Visit website
Smartsheet is an online work execution platform empowering organizations of all sizes to plan, manage, automate, and report on work. Over 80,000 brands rely on Smartsheet for project and work management.
As organizations worldwide continue to adapt to an increasingly competitive landscape and a rapidly evolving business environment, the demand for effective project management solutions has never been greater. Companies of all sizes are recognizing the need to streamline workflows, enhance collaboration and boost overall productivity. Implementing the right project management software can help businesses stay ahead of the curve by ensuring projects are completed on time, within budget and with optimal resource allocation.
Jump to:
Top project management software comparison
Alongside pricing, here are some of the most important features that set apart the best project management software on the market. The table below illustrates which of the top 10 project management tools include these key features.
Software
Pricing
Native time tracking
Multiple view types
Customizable templates
Task management
Free plan
monday work management
$8 per user per month
Yes
Yes
Yes
Yes
Yes
Smartsheet
$7 per user per month
No
Yes
Yes
Yes
Yes
ClickUp
$5 per user per month
No
Yes
Yes
Yes
Yes
Teamwork
$5.99 per user per month
Yes
Yes
Yes
Yes
Yes
Wrike
$9.80 per user per month
Yes
Yes
Yes
Yes
Yes
Asana
$10.99 per user per month
No
Yes
Yes
Yes
Yes
Trello
5 per user per month
No
Yes
Yes
Yes
Yes
Zoho Projects
$4 per user per month
No
Yes
Yes
Yes
Yes
Confluence
$5.75 per user per month
No
Yes
Yes
Yes
Yes
Jira
$7.75 per user per month
No
Yes
Yes
Yes
Yes
monday work management: Best for teams of all technical levels
Image: monday.com
monday work management is a reputable project management brand with a flexible platform for teams of all flavors. While initially intimidating, the monday work management interface is packed with features and offers extensive configuration management capabilities. While other solutions lean into a few views of project data, monday work management gives users the most flexibility in adding and configuring valuable visualizations.
Though I ran into hiccups using monday work management, the project management software excels in configurability, giving teams the expected control to optimize workflows.
Pricing
Individual: $0 for up to two seats.
Basic: $8 per seat per month billed annually, or $10 per seat per month billed monthly. A free trial is available.
Standard: $10 per seat per month billed annually, or $12 per seat per month billed monthly. A free trial is available.
Pro: $16 per seat per month billed annually, or $20 per seat per month billed monthly. A free trial is available.
Enterprise: Quotes are available upon request.
Features
Visualize project data through multiple tables (Figure A), kanban and dashboard views.
Personalize colorful interfaces that bring project data to life.
Customize and share surveys for data collection via the WorkForms tool.
Access integrations for developers, marketing, CRM and project management.
Utilize pre-built automations and a long list of options for creating automation rules.
Figure A
Image: monday.com. In monday work management, users can optimize their teams’ workflows.
Top integrations
Jira
GitHub
Slack
Dropbox
Pros
Clean user interface not bogged down by the platform’s extensive features.
Robust configurations for setting the workspace and tools to team specifications.
Designed for a multitude of use cases across industries and functions.
Cons
An evident learning curve for new users and implementing advanced features.
Import engine failed to pull most existing data into the platform.
Manually inputting data to reconcile imports was the biggest pain point.
Why we chose monday work management
We choose monday work management for its outstanding versatility as project management software. It’s a powerful tool for a variety of project management use cases and offers robust features for team collaboration tools, automation features and customization.
For more information, read the full monday work management review.
Smartsheet: Best for spreadsheet lovers
Image: Smartsheet
Launched in 2005, Smartsheet’s project and work management platform is one of the safest bets in the project management software market. From onboarding to using the platform, I was impressed by the interface’s user-friendliness and the features’ extensibility. Smartsheet offers an upgrade from traditional tools by adding accessible user experience features, needed integrations, robust configurability and no-code capabilities to a spreadsheet interface.
Smartsheet pricing is among the highest on the market, and there is no unlimited free plan. Still, I believe the platform’s benefits more than justify consideration for small teams up to enterprise organizations.
Pricing
Pro: $7 per user per month billed annually, or $9 per user per month billed monthly. A free trial is available.
Business: $25 per user per month billed annually, or $32 per user per month billed monthly. A free trial is available.
Enterprise: Quotes are available upon request.
Features
Ability to create, import and manage project data on a central cloud-based platform.
Ability to visualize project data through the Grid (Figure B), Gantt, Card and Calendar views.
Flexible options for setting and adjusting project field data.
Access to WorkApps, the platform’s no-code tool for building web and mobile apps.
Activity log for tracking change management with filters to identify actions.
Figure B
Image: Smartsheet. Add comments, attachments and proofs to rows, or expand and condense tasks to view project details in Smartsheet’s Grid view.
Top integrations
Microsoft Teams
Slack
Salesforce
Zapier
Pros
Friendly user interface for moving from legacy spreadsheet tools.
Extensive documentation and access to onboarding assistance.
Prebuilt project and automation templates to get to work fast.
Cons
Several tools are add-ons, requiring an additional purchase.
Security features are limited to the Enterprise subscription.
Premium support is only available for higher-tier plans.
Why we chose Smartsheet
While Smartsheet is ideally suited for users who prefer a spreadsheet-style interface, it offers several advanced project management features that help streamline processes and save time. The clean and simple layout makes for an easy learning curve, and for users who don’t want to start from scratch, they can use the customizable templates from the library.
SEE: Read our Smartsheet review, or check out how Smartsheet compares to monday work management and Asana.
ClickUp: Best for teams on a tight budget
Image: ClickUp
The fastest mover in the project management software space is ClickUp. Only five years after its founding, the San Diego-based startup has grown into one of the top project management solution providers. ClickUp far exceeded my expectations with a stack of project views and tools to enable productivity and collaboration for a wide variety of functional teams.
Add in ClickUp’s handful of affordable subscriptions for different team sizes, and it’s difficult not to consider this budding project management software.
Pricing
Free Forever: $0; best for personal use.
Unlimited: $5 per user per month billed annually, or $9 per user per month billed monthly.
Business: $12 per user per month billed annually, or $19 per user per month billed monthly.
Business Plus: $19 per user per month billed annually, or $29 per user per month billed monthly.
Enterprise: Quotes are available upon request.
Features
Visualize project data through the List (Figure C), Board, Gantt, Calendar, Workload and Map views.
Create and modify tasks or bulk edit tasks from a list of potential operations.
Manage granular configurations of platform features and security.
Track and visualize project data through the Dashboards view.
Import data from monday, Asana, Trello, Jira, Wrike, Basecamp and Todoist.
Figure C
Image: ClickUp. The List view in ClickUp allows users to bulk edit multiple tasks.
Top integrations
Pros
Widest and most affordable range of plans to meet different-sized team needs.
Robust configurability for customizing and managing platform workflows.
Access to over 1,000 integrations for developers, business suites, storage and more.
Cons
Slight variance between the imported file and platform results.
Some platform actions are less intuitive and require additional troubleshooting.
Occasional lagging between moving pages and lingering platform notices.
Why we chose ClickUp
We picked ClickUp as one of the best project management software for its affordable pricing plans, comprehensive features and customizable workflows. In addition, the friendly user interface makes it a top choice for users of all technical levels.
SEE: Read our ClickUp review, or see how ClickUp compares to Notion, Trello and Asana.
Teamwork: Best for time tracking and budgeting
Image: Teamwork
As the name implies, Teamwork is project management software that enables team and workload management. The Ireland-based platform offers a similar range to other top project management solutions but excels in time tracking, budgeting and stakeholder management. Whether it’s personnel or a third-party contractor, Teamwork is fit for optimizing the globally distributed workflows of tomorrow.
While a few actions during my experience with Teamwork didn’t seem as intuitive as other platforms, the platform and its potential to organize team projects are impressive.
Pricing
Free Forever: $0 per month for up to five users.
Starter: $5.99 per user per month billed annually, or $8.99 per user per month billed monthly. A free trial is available.
Deliver: $9.99 per user per month billed annually, or $13.99 per user per month billed monthly. A free trial is available.
Grow: $19.99 per user per month billed annually, or $25.99 per user per month billed monthly. A free trial is available.
Scale: Quotes are available upon request.
Features
Visualize project data through the Gantt, kanban, dashboard (Figure H), calendar and table views.
Build and generate reports of project data to share via CSV, Excel or PDF.
Create project templates, dashboards, risks and project-level tags for re-use.
Integrate with Zapier, Google Drive, Box, Slack, Microsoft, HubSpot and more.
Access built-in Teamwork apps for collaborative spaces, IT help desks, customer relationship management and web chats.
Figure D
Image: Teamwork. The dashboard view in Teamwork automatically breaks down project data and metrics.
Top Integrations
Slack
Google Drive
Microsoft Teams
Usersnap
Pros
Strongest time tracking and workload management capabilities of the products I reviewed.
Deep range of features emulating the best in the project management software market.
Free 30-day trial, an unlimited free plan and affordable annual subscriptions.
Cons
Basic Agile support and burndown reports are only available with higher plans.
Configure notification settings, or get ready for a full inbox.
Modifications sometimes took several seconds to load.
Why we chose Teamwork
Teamwork offers excellent tools for time tracking and budgeting and has the capacity to handle projects of all sizes. The extensive range of features, including multiple project views, team collaboration tools and integrated file sharing, earns Teamwork a spot on this list.
SEE: For more information, check out our full Teamwork review, or see how Teamwork compares to monday work management.
Wrike: Best for portfolio management
Image: Wrike
The newest subsidiary of Citrix, Wrike was already one of the biggest names in project management software even before its backing by the cloud computing giant. With the capacity to manage entire project portfolios, Wrike’s feature set includes custom request forms, risk predictions, invoicing software and enterprise-grade security. I found the platform incredibly powerful, with clear use cases for small businesses, enterprise organizations and various team functions.
Upon first glance, the user interface is busy, and Wrike’s learning curve is likely the steepest in the project management software space. That said, few vendors offer the same extent of enterprise capabilities.
Pricing
A free trial is available for each of the following plans:
Free: $0 per user per month.
Team: $9.80 per user per month.
Business: $24.80 per user per month.
Enterprise: Quotes are available upon request.
Pinnacle: Quotes are available upon request.
Features
Visualize project data through the table, list, board, Gantt, timelog and analytics views (Figure E).
Add and edit task duration, approvals, time entries, subtasks, files and dependencies.
Access project templates for Agile, creative, IT operations and project management office teams.
Utilize customer-managed encryption keys and external encryption key storage via AWS.
Access to over 400 app integrations and two-way sync with almost 30 other apps.
Figure E
Image: Wrike. No matter the view, users can open task details to view, edit or attach data for team visibility.
Top integrations
Power BI
Salesforce
Zoom
Google Drive
Pros
Plans for teams managing complex workloads, marketing and professional services.
Extensive interoperability and workflow capabilities with business-critical applications.
Enterprise-ready with premium security and data privacy controls.
Cons
More expensive than most project management solutions.
Steep learning curve for maximizing the extent of platform features.
Several tools are only available as add-on features or for higher subscriptions.
Why we chose Wrike
Wrike is known for its ease of use and team collaboration, making it ideal for project managers who handle multiple projects. Another key reason why we chose Wrike was its scalability, making it a great choice for hyper-growth teams.
SEE: Find out more in our Wrike review, or see how Wrike compares to monday work management and Trello.
Asana: Best for extensibility
Image: Asana
One of the most popular project management software solutions, Asana is the work management platform started by former Facebook developers in 2008. The Silicon Valley-based company has grown dramatically in that time, and the platform’s extensibility affirms why so many businesses choose it. From viewing team member workloads to adding strategic goals and setting user security policies, I believe Asana has something for every team.
Though some actions were less intuitive, Asana made up for them with the documentation and resources to guide platform projects efficiently.
Pricing
A 30-day free trial is available for these Asana plans:
Basic: $0 per user per month.
Premium: $10.99 per user per month billed annually, or $13.49 per user per month billed monthly.
Business: $24.99 per user per month billed annually, or $30.49 per user per month billed monthly.
Features
Visualize project data through the list (Figure F), board, timeline, calendar and workload views.
Manage and create project data with custom fields, rules and forms.
Enable the built-in time tracking tool to visualize time spent on tasks.
Import data from Airtable, Google Sheets, monday work management, Trello, Smartsheet and Wrike.
Add integrations for communications, files, finance, IT, reporting, sales and security.
Figure F
Image: Asana. The List view in Asana looks similar to a spreadsheet and allows users to view, modify or communicate through task details.
Top integrations
OneDrive
Slack
Jira
Harvest
Pros
Robust feature set competing with the best in project management software.
Friendly user interface and flexible controls for different tools.
Extensive import options, including multiple top project management platforms.
Cons
At times, the interface is less intuitive than competing project management platforms.
There is a steep learning curve for deploying some features and advanced tools.
Occasional error messages and lag occur when moving between platform pages.
Why we chose Asana
Asana is an outstanding task management and team collaboration software. It’s flexible, fast and feature-rich and offers a generous free plan. The flexibility offered by Asana means it can be used by businesses of all sizes. In addition, you get several import options, making it easy for users to transition to Asana from other software or use the Asana with other applications.
SEE: Explore our Asana review, or see how Asana stacks up against Planner, Notion and Airtable.
Confluence: Best for project document management
Image: Confluence
Confluence is a team collaboration and project management software with outstanding document management and knowledge-sharing features. It is suitable for any size or type of team. Users can also use Confluence to create and track tasks on one centralized platform.
Pricing
Free: No cost for up to 10 users.
Standard: $5.75 per user if billed monthly, or $580 per year for 1–10 users.
Premium: $11 per user if billed monthly, or $1,100 per year for 1–10 users.
Enterprise: Customized pricing.
Features
Expensive template library. This includes customizable templates and blueprints for a variety of use cases.
Version control and history feature to track changes to files over time.
Atlassian Analytics tools (Figure G) to gain valuable insights for informed decision-making.
Bulk archive feature to archive multiple outdated or obsolete pages in one go.
Figure G
Analytics tools in Confluence.
Top integrations
Jira
Trello
Salesforce
Zendesk
Pros
Strong in-app learning content.
Outstanding document management tools.
Centralized knowledge hub.
Cons
Limited team collaboration tools.
Performance issues with a large volume of data.
Why we chose Confluence
Confluence offers some advantages over other competitors, including a centralized knowledge repository, robust document search and discovery feature, and file sharing. Users already using Atlassian products will find Confluence a powerful addition to the ecosystem.
SEE: For more information, read our full Confluence review.
Zoho Projects: Best for multiple project visualizations
Image: Zoho Projects
Under the Zoho portfolio of solutions, Zoho Projects offers teams a stack of features for tracking tasks, issues, time and resources to maximize collaboration and productivity. Users can visualize and adjust project data through views like a traditional spreadsheet, simple list, kanban board or Gantt chart in real time or automate mapped workflows with the Blueprints tool.
Zoho Projects offers a lot of functionality, considering it’s the most affordable project management software. However, it also lacks some of the configurability and advanced features included in the top tier of platforms.
Pricing
Free: $0 for up to three users.
Premium: $4 per user per month billed annually, or $5 per user per month billed monthly. A free trial is available.
Enterprise: $9 per user per month billed annually, or $10 per user per month billed monthly. A free trial is available.
Features
Visualize project data through the classic (spreadsheet), plain (list) and kanban views.
Create project baselines to compare expected versus real progress on tasks.
Track time for tasks to inform workload and resource management.
Integrate with critical apps for Google, Microsoft, code repositories and more.
Access Zoho Apps like Mail, Docs, CRM, Desk, Analytics and Forms.
Top integrations
Zoho CRM
Slack
Google Suite
Zapier
Pros
Least expensive subscription plans among the top project management platforms.
Robust feature set considering its affordability.
Familiar interface and bundling value for existing Zoho customers.
Cons
Lagging when moving between different platform pages.
Limited options for viewing project data relative to competitors.
Some platform actions, like creating multiple subtasks, aren’t intuitive.
Why we chose Zoho Projects
If you are looking for value for money, it doesn’t get any better than Zoho Project. This low-cost project management app offers outstanding value. You get multiple channels for team collaboration and communication and a quick and easy setup.
SEE: For more information, read our full Zoho Projects review.
Trello: Best for basic users
Image: Trello
Trello is the ideal tool for users who want simplified project management. Its Kanban-based interface makes it easy to manage and track any type of project. While it might not be able to handle complex projects, Trello offers enough features to handle core project management tasks, including task automation, file sharing, and team collaboration.
Pricing
Free: Up to 10 boards per workspace.
Standard: $5 per user per month if billed annually, or $6 per user per month if billed monthly.
Premium: $10 per user per month if billed annually, or $12.50 per user per month if billed monthly.
Enterprise: $17.50 per user per month when billed annually.
Features
Project checklists to help break big projects into more manageable tasks.
File attachment feature with drag-and-drop functionality.
Automate workflows through Trello’s built-in automation builder (Figure H).
Extensive library of pre-built templates.
Figure H
Trello’s automation builder “Butler”.
Top integrations
Dropbox
GitHub
Jira
Slack
Pros
Generous free plan.
Highly visual interface.
Variety of add-ons.
Powerful automation tools.
Cons
Heavily reliant on the kanban view.
Not designed to handle complex projects.
Why we chose Trello
Trello earns a spot on our list of best project management software with its feature-rich free plan, collaboration tools and outstanding ease of use. The Kanban-style interface is visually appealing and feels intuitive. In addition, the efficiency offered by Trello helps simplify project management.
SEE: For more information, read our full Trello review.
Jira: Best for development teams
Image: Jira
Atlassian’s portfolio of collaboration, code management and security solutions is led by its flagship project tracking software, Jira. In response to a growing number of general-use project management solutions, Jira Software offers a mix of project data views, reporting and configuration capabilities with the Work Management platform included in its suite of products.
Jira is ideal for organizations already using Jira products or teams relying on integrations like private repository host BitBucket. Otherwise, its general project management functionality is below par relative to the broader project management marketplace.
Pricing
Free: $0 for up to 10 users.
Standard: $7.75 per user per month billed monthly and $790 annually for 1–10 users.
Premium: $15.25 per user per month billed monthly and $1,525 annually for 1–10 users.
Enterprise: Available for teams with more than 800 users and only billed annually. Contact Jira sales for pricing information.
Features
Visualize project data through the list, board, timeline (Figure I) and calendar views.
Import existing work to create project issues and collect data through forms.
Access a Summary page embedded with key performance indicators for progress, priorities and workloads.
Integrate with Jira Software and other Atlassian tools.
Start from 20 prebuilt templates for finance, marketing, human resources and legal teams.
Figure I
Image: Jira. Timeline view on Jira displays tasks and dependencies against a timescale by week, month or quarter.
Top integrations
Github
Lucidchart
Confluence
Microsoft Teams
Pros
More than 500 integrations and 3,000 extensions for workflow apps.
Bundle with Atlassian’s portfolio of tools like BitBucket, Crucible and Trello.
Built-in time tracking tools for tracking effort against tasks.
Cons
Higher learning curve for non-software development teams.
Not as intuitive as other top project management tools.
Still a developing application relative to Jira Software’s accolades.
Why we chose Jira
Jira is one the best project management software for its Agile support, bug tracking and issue management capabilities. While these features are most suitable for software development, they can be used for a variety of other applications.
SEE: For more information, read our Jira review, or see how Jira compares to Asana and Trello.
What are key features of project management software?
The key features of project management software vary depending on the specific tool, but generally, these are some of the most important features to look for when evaluating a solution.
Task management
Effective task management capabilities enable users to create, assign, track and update tasks, providing a clear overview of individual responsibilities and overall project progress. This feature is essential for keeping teams organized and ensuring that everyone understands their roles and deadlines, contributing to the successful completion of projects.
Customizable workflows
Customizable workflows allow teams to create and modify workflows according to their unique processes and preferences, ensuring the software is adaptable to their specific needs and requirements. This flexibility enables teams to tailor their project management system to suit their project types, methodologies and industry best practices, ultimately improving efficiency and effectiveness.
Collaboration and communication
Project management software should foster seamless collaboration and communication among team members through features like real-time chat, file sharing, commenting and notifications. These tools help keep everyone on the same page and streamline decision-making, making it easier to coordinate work, resolve issues and ensure that projects stay on track.
Multiple views
Providing various views such as Gantt charts, kanban boards, list views and calendar views allows users to visualize project data in different ways, catering to individual preferences and enhancing overall project comprehension. This feature helps teams monitor progress, identify potential bottlenecks and plan work more effectively.
Native time tracking
Time-tracking capabilities help teams monitor the time spent on tasks and projects, facilitating better resource allocation and promoting efficient time management. This feature enables organizations to optimize productivity, manage budgets and accurately bill clients for work completed.
Custom fields
Custom fields enable teams to add personalized data points to tasks and projects, making it easier to track, filter and report on the unique information relevant to their organization. This feature provides additional flexibility and customization, ensuring teams can capture and manage the data that matters most to them.
Document and file management
Integrated document and file management features allow users to store, share and collaborate on project-related files, ensuring easy access and organization. This functionality helps keep essential documents and resources centralized, streamlining communication and reducing the risk of misplacing or duplicating files.
Reporting and analytics
Comprehensive reporting and analytics tools help users gain insights into project performance, identify bottlenecks and make informed decisions based on real-time data. These features enable teams to continuously improve their processes, allocate resources more effectively and optimize overall project success.
Resource management
Effective resource management capabilities enable teams to allocate resources such as personnel, equipment and budgets optimally, ensuring projects are completed efficiently and cost-effectively. This feature helps organizations balance workloads, avoid overloading team members and prevent resource conflicts.
Third-party integrations
Integration with other tools and software, such as customer relationship management systems, accounting tools and productivity suites, can enhance the project management software’s functionality and streamline workflows. This feature enables teams to connect their project management system to other essential tools, reducing manual data entry and facilitating a more seamless working experience.
What are the benefits of project management software?
Project management software offers a multitude of benefits that can significantly enhance team productivity and efficiency. Let’s delve into some of the most compelling advantages that these tools can provide.
Improved organization and prioritization
Project management software offers a comprehensive and structured approach to organizing tasks and projects, making it easier for teams to stay focused and prioritize work. It enables users to break projects down into smaller, manageable tasks and assign deadlines, ensuring that teams can effectively allocate resources and time to critical activities. By categorizing and prioritizing tasks, team members can better understand their responsibilities and overall project progression, reducing confusion and miscommunication.
SEE: Improve your project organization with these top project portfolio management software.
Enhanced collaboration and communication
A key benefit of project management software is the facilitation of team collaboration and communication. By providing a centralized platform, team members can easily share information, documents and updates on their progress. This visibility allows for more effective communication, faster decision-making and better issue resolution. Additionally, such tools often have integrated communication features, like chat or comment sections, which can help streamline communication and ensure everyone is on the same page.
Time and resource management
Project management software helps teams efficiently manage their time and resources, ultimately leading to increased productivity. These tools often include features like time tracking, workload balancing and resource allocation, which allow teams to make informed decisions about how to best utilize their time and resources. By monitoring progress and identifying bottlenecks, managers can make adjustments and reallocate resources as needed to keep projects on track.
Accurate budget tracking and financial control
Managing budgets is a critical aspect of any project and project management software can help ensure financial control. With features like cost estimation, expense tracking and financial reporting, teams can monitor budgets and make informed decisions to avoid overspending. This level of financial control and visibility not only helps projects stay within budget but also supports better forecasting for future projects.
Increased accountability and transparency
Project management software increases accountability and transparency by providing a clear overview of tasks, responsibilities and deadlines. This visibility helps ensure team members understand their roles and take ownership of their work. Moreover, the software allows for real-time progress tracking, making it easier to hold individuals accountable for meeting deadlines and completing tasks. This improved accountability fosters a sense of ownership and responsibility within the team, leading to better overall project outcomes.
Streamlined reporting and decision-making
Finally, project management software simplifies reporting and decision-making by consolidating data from various sources into customizable dashboards and reports. This enables stakeholders to access relevant information quickly and make data-driven decisions. By providing insights into project performance, teams can identify areas for improvement and implement changes, ensuring projects stay on track and meet objectives.
Considerations for project management tools
Use cases and audience
Most project management software solutions speak to a broad audience of potential use cases. Across industries and departments, the use cases mentioned most for project management tools include:
Agile, scrum and other software development methodologies.
Campaign and client management.
Content creation and digital asset management.
Event planning and management.
Issue, request, ticket and bug tracking.
Lead tracking and sales pipeline.
Onboarding and offboarding personnel.
Product management and features backlog.
Resource, time and workload allocation.
Integrations
As with the two software development project management picks, the range of integrations offered by top project management platforms is a crucial differentiating factor. Teams across the globe increasingly rely on a stack of applications to conduct everyday work. Considering project management software is meant to enable productivity in teams existing workflows, the lack of a critical integration is a dealbreaker.
Customer support and service
Finally, teams relying on project management software for critical business operations also need to ensure the level of technical support meets expectations. Teams are bound to encounter unexpected outages, roadblocks and platform issues, making regular availability by phone or web chat essential to business continuity.
How do I choose the best project management software for my business?
The best project management software should offer a combination of user-friendliness, customization and scalability to meet the needs of your team and organization. It should be intuitive and easy to navigate, allowing users to perform tasks with minimal training. The software should also be adaptable, providing the ability to tailor features and workflows to suit the organization’s specific requirements. Scalability is another essential aspect, ensuring that the software can accommodate growth in team size, project complexity and workload.
SEE: Working on a smaller team? Explore top project management software for small businesses.
Effective communication, time and resource management and comprehensive reporting are vital features of a top project management tool. Collaboration and communication features should streamline information sharing and decision-making, while time and resource management capabilities help optimize productivity. Robust reporting and analytics functionalities are crucial for informed decision-making and continuous improvement. Integration with other tools, such as CRM systems or productivity suites, can further enhance efficiency.
Lastly, consider the security, reliability and cost-effectiveness of the software. Robust security measures, such as encryption and access controls, are necessary to protect sensitive project data. Reliability in terms of uptime and responsive customer support ensures a seamless experience. The best project management software should offer value for money, balancing features and functionality with cost. Evaluating customer reviews, case studies and testimonials can provide valuable insights into the tool’s suitability for your organization’s specific needs.
Methodology
To compile this list of the best project management software, we did a deep dive into several parameters and features of the software. This complete analysis includes an assessment of the usability of the software, standout features, and security tools.
For the assessment of the user interface, we looked at the ease of navigation and visual appeal of each software. An intuitive user interface plays a key role in the overall user experience. We also analyzed the functionality and features of each software, including core and advanced tools. In addition, the performance and stability of each software were assessed to check the responsiveness and efficiency of the software.
For a more thorough understanding of ease of use, we looked at several other aspects of the software, including ease of setup, scalability and user support. Lastly, we did an analysis of the compatibility and integration of each software to check how it would fit into different technology ecosystems.
Gusto payroll is a top payroll solution for many — or even most — small and midsize businesses that run payroll in house. Its reasonable starting price, built-in employee benefits and helpful blend of HR and payroll tools set it apart in the crowded field of payroll software.
But Gusto might not work for you, especially if you need comprehensive international payroll or thorough HR and compliance features.
For instance, Rippling is the top Gusto alternative for growing businesses with more complex payroll needs. Meanwhile, a competitor like OnPay is ideal for small businesses that like Gusto’s price but need more HR assistance than Gusto provides. Keep reading to learn more about whether Gusto or an alternative is the best payroll choice for you.
Jump to:
Top Gusto competitors and alternatives: Comparison table
Gusto and its top competitors all provide full-service payroll with unlimited payroll runs, federal and state tax filing, direct deposit and accounting software integration.
Feature
Starting base price
Starting price per payee
International payroll
Health insurance benefits
Learn more
Gusto
$40/mo.
$6/payee
Contractors only
37 states
Try Gusto
Rippling
Unlisted
$8/payee
Yes
50 states
Try Rippling
OnPay
$40/mo.
$6/payee
No
50 states
Try OnPay
SurePayroll
$19.99/mo.
$4/payee
No
50 states
Try SurePayroll
Paychex Flex
$39/mo.
$5/payee
Yes
50 states
Try Paychex
Papaya Global
N/A
$12/payee
Yes
International
Try Papaya
Justworks
N/A
$59/payee
No
50 states
Try Justworks
Square Payroll
$35/mo.
$6/payee
No
50 states
Try Square
Roll by ADP
$29/mo.
$5/payee
No
None
Try Roll by ADP
Top Gusto competitors
Gusto primarily targets small and midsize businesses, though it can work well for some large businesses that use separate HCM or HR software for people management. For the most part, though, the Gusto competitors we review below target the same audience — with a few exceptions.
Growing businesses and international companies should prioritize Rippling and Papaya Global. If you need a heftier payroll and HR solution, look into our review of the best payroll software for enterprises, which covers more comprehensive payroll software like Workday HCM.
Rippling: Best for growing businesses
Image: Rippling
Our star rating: 3.8 out of 5
Like Gusto, Rippling calculates employee paychecks, remits state and federal taxes on behalf of employers, and offers health benefits and built-in benefit administration. From there, the two payroll providers diverge drastically: Rippling is more scalable, more customizable and more expensive than Gusto.
Rippling also has more features than Gusto, making it better suited for growing businesses with complex financial and HR needs. While Gusto focuses almost entirely on payroll with some HR features, Rippling’s all-in-one approach consolidates payroll, HR, expense tracking, IT management and financial forecasting.
Because Rippling’s plans are so customizable, the software can accommodate all business sizes and budgets. It can serve small businesses that need payroll for one or two employees as well as enterprises that manage payroll and benefits on a global scale. In contrast, Gusto is better suited to businesses that want payroll features, employee benefits and easy time tracking without any extra bells and whistles.
Features
International payroll processing for global employees and contractors.
Fully integrated HR, payroll and finance tools.
Thorough learning management suite.
Optional PEO solution.
Pros
Extremely scalable solution that accommodates businesses with two to 2,000 employees.
Fully customizable plans.
Integrations with top third-party business apps, including PayPal, Trello and Jira.
Unique HRIS features like remote device management and corporate cards.
Cons
Per-payee fees for each module can cause monthly fees to add up quickly.
Customer complaints of slow setup.
Frequent, ongoing changes and software updates can be confusing for users.
Pricing
Rippling payroll starts at $8 per employee per month on top of an unlisted monthly base fee. Unfortunately, apart from its per-employee payroll fee, Rippling doesn’t list its prices online. Contact Rippling directly to assemble a custom plan with custom pricing.
For more information, read our full Rippling review.
OnPay: Best industry-specific payroll plans
Image: OnPay
Our star rating: 4.2 out of 5
SurePayroll is an exceptionally affordable payroll provider for small and midsize businesses, especially when compared to Gusto, OnPay and other top Gusto competitors.
Business owners who want to save money on payroll services can opt for SurePayroll’s self-service plan, which includes automatic tax calculation but leaves withdrawal and remittance up to you. However, even SurePayroll’s full-service plan — which includes automatic tax calculation, remittance and filing — is cheaper than most competitors (with the exception of Patriot Payroll, which notably has far fewer HR tools than SurePayroll).
While SurePayroll doesn’t have Paychex’s comprehensive HR add-ons or Gusto’s impressive suite of third-party integrations, it includes HR library access, built-in benefits administration and multiple time-tracking options. Through its parent company, Paychex, SurePayroll can offer high-level benefits in all 50 states without charging abysmal prices.
Features
Payroll autopilot feature.
Health insurance benefits in all 50 states.
HR library access.
Optional workers’ compensation insurance and pre-employment screening tools.
Pros
Affordable self-service and full-service payroll plans.
Up to six months free for new customers.
Expanded customer support hours and overall positive customer service reputation.
Cons
Two plans only with limited scalability.
Fewer HR features than OnPay, Paychex and other payroll competitors.
Pricing
SurePayroll has two plans:
SurePayroll Self-Service costs $19.99 per month plus $4 per employee.
SurePayroll Full-Service costs $29.99 per month plus $5 per employee.
SurePayroll also charges a flat fee of $9.99 for multi-state payroll.
For more information, read our SurePayroll review.
Paychex Flex: Best HR features
Image: Paychex
Our star rating: 3.5 out of 5
Compared to most other Gusto alternatives — as well as to Gusto itself — Paychex Flex is the heftiest all-in-one payroll and HR solution on our list. Each Paychex plan includes labor posters, solid employee onboarding tools and access to a comprehensive HR document library. Higher-tier plans add HCM features like performance management and LMS access.
However, Paychex charges far more for crucial payroll and HR features that competitors (including Gusto) typically offer at no additional fee. For instance, unlike Gusto and OnPay, Paychex charges an extra fee for benefits administration, general ledger integration, state unemployment insurance administration, e-document management — and more.
As a result, Paychex isn’t a particularly affordable or scalable option for small businesses with a limited payroll budget.
SEE: Gusto vs. Paychex: Which Payroll Software Is Better for Your Business?
Features
Legally compliant labor posters with every plan.
Thorough HR and HCM add-ons like recruiting and applicant tracking, pre-employment screening and job-posting site integration.
Well-reviewed mobile payroll apps for both employers and employees.
Multiple payroll and HR solutions, including payroll software and PEO service.
Pros
High-quality employee benefits options in all 50 states.
HR library access with thorough HR templates and documents.
International payroll through third-party partner FMP Global.
Cons
Far more add-on fees than most Gusto competitors, including fees for benefits administration, online document storage and accounting software integration.
Expensive software.
Poor customer service reputation and complaints of slow response times.
Pricing
Typically, Paychex Flex lists the pricing for just one of its plans online. However, during the company’s sales periods, it lists the discounted pricing for its two most expensive plans as well:
Paychex Flex Essentials costs $39 per month plus $5 per employee.
Paychex Flex Select starts at $47 per month plus $3 per employee (with current promotion of 65% for new customers, promo period ending 8/31/23).
Paychex Flex Pro starts at $95 per month plus $3 per employee (with current promotion of 65% off, promo period ending 8/31/23).
For more information, read our Paychex review.
Papaya Global: Best for multinational companies
Image: Papaya Global
Our star rating: 3.7 out of 5
Gusto lets business owners pay international contractors in 120 countries, but you can’t use Gusto to pay traditional employees in any country besides the United States. Papaya Global, in contrast, is a global payroll service that lets businesses pay both contractors and employees in 160+ countries.
As a professional employer organization, Papaya Global becomes a co-owner of your company and takes responsibility for most aspects of personnel management. Like Paychex, Papaya has multiple payroll solutions, making it a more flexible payroll company than a software-only company like Gusto.
For instance, Papaya’s Employer of Record service allows it to become your workers’ legal employer, taking the most complicated legal and HR aspects of international employment and payroll off your plate. Smaller companies with a more limited budget can use Papaya’s payroll platform licensing to pay global employees without switching payroll providers for just $3 per payee per month.
Features
Payments in local currencies.
Thorough workforce analytics and payroll reporting.
Comprehensive country-specific compliance audits and alerts.
Optional contractor-only payroll plan.
Pros
Transparent online pricing.
Versatile payroll options, including PEO and EOR services.
Competitive location-specific benefits in 160+ countries.
Cons
Far fewer third-party integrations than most national and international payroll competitors.
High pricing may be outside small and midsize businesses’ budgets.
Email-only customer support.
Pricing
For more information, read our Papaya Global review.
Justworks: Best PEO solution
Image: Justworks
Our star rating: 3.7 out of 5
In contrast to payroll software providers like Gusto and OnPay, Justworks is a PEO that assumes co-ownership with your company to manage payroll and HR on your behalf. And unlike Papaya Global’s PEO service, Justworks doesn’t offer international payroll for either independent contractors or traditional employees. However, Justworks is an affordable payroll alternative for U.S. companies that want to outsource as many aspects of human resources as possible.
Features
Hands-on compliance management.
Bi-weekly and weekly pay schedules with no additional fee for off-cycle runs.
Unique health and wellness benefits.
Multi-state payroll at no additional fee.
Pros
Notably streamlined, user-friendly software.
24/7 customer service available via live chat, SMS, Slack, email and phone.
High-quality benefits options in all 50 states.
More affordable than many PEO competitors like ADP TotalSource.
Cons
Fewer payroll features than Gusto and other payroll-specific competitors.
Comparatively few payroll reports.
Limited accounting integrations (only Xero and QuickBooks Online).
Pricing
For more information, read our Justworks review.
Square Payroll: Best for paying contractors
Image: Square
Our star rating: 3.7 out of 5
Like Gusto, Square Payroll has a contractor-only payroll plan with no monthly base fee. However, Gusto waives its base fee for only six months. After that point, users pay a base fee of $35 a month plus a $6 per-payee fee. In contrast, Square Payroll permanently waives its base fee for business owners who use Square to pay only contractors. Plus, Square charges you for the contractors you pay each month, not by the number of freelancers on your payroll, and allows for free seasonal inactivity.
Square Payroll doesn’t integrate with as many third-party business apps as most Gusto alternatives on our list, but it does sync perfectly with Square Point of Sale, which doubles as a time-clock system for employees. If you’re already using Square’s products, especially its point of sale service, Square Payroll is a logical, user-friendly payroll choice.
Features
Multiple employee pay options including direct deposit, paper check and Cash App payouts.
Highly rated mobile payroll app for employers.
Optional workers’ compensation insurance and employee health insurance benefits with no additional fees for integration.
Pros
Affordable payroll plans, especially for contractor-only payroll (no base fee).
No additional fees for services like end-of-year W-2 and 1099 filing.
Extended customer service hours (weekdays only).
Cons
One plan only (limited scalability for growing companies).
Fewer HR features than most payroll software for small businesses.
Fewer third-party integrations than most Gusto competitors.
Pricing
Square Payroll has two plans, both at lower-than-average prices:
Square’s Pay Contractors Only plan costs $6 per month per contractor paid.
Square Pay Employees & Contractors plan costs $35 per month plus $6 per payee.
For more information, read our Square Payroll review.
Roll by ADP: Best for microbusinesses
Image: Roll by ADP
Our star rating: 3.2 out of 5
Roll by ADP is a relatively new, chat-based payroll service from global payroll provider ADP. In contrast to ADP’s other products, which are typically fully featured and easy to scale, Roll by ADP distills payroll down to the basics. The app automatically calculates paycheck amounts, makes payroll tax deductions, remits taxes to the correct agency and pays your employees through automatic direct deposit — and that’s about it.
Since Roll by ADP lacks benefits administration and any HR tools beyond basic employee self-onboarding features, it’s best suited to incredibly small businesses with just a handful of tech-savvy employees. It’s a solid Gusto alternative for employers who want to minimize payroll expenses and who primarily run their businesses from their phones.
On the other hand, if you want more comprehensive payroll and HR or prefer a payroll system that doesn’t run on AI-powered chat, SurePayroll or OnPay could be a better fit.
Features
App-first payroll system with optional laptop or desktop access.
Built-in integration with QuickBooks Online.
Multi-state payroll processing.
AI-based audits, compliance and alerts.
Pros
Extremely streamlined app for simple hassle-free payroll runs.
One flat fee with no unexpected or add-on fees.
Simple self-guided setup for employers and employees.
Three-month free trial.
Cons
No benefits options or HR tools.
Limited scalability (one plan only with limited features).
Chat-based customer support.
Chat-based platform comes with a learning curve.
Pricing
Roll by ADP costs a flat fee of $29 per month plus $5 per employee paid. ADP currently advertises a three-month free trial for new Roll users.
For more information, read our Roll by ADP review.
Is Gusto worth it?
Image: Gusto
Our star rating: 4.1 out of 5
Gusto is a solid payroll choice for many small and midsize businesses in any industry. Its user-friendly interface should appeal to new employers who want a simple, straightforward tool to pay their workers.
Since Gusto is one of the most popular payroll providers in the U.S., it syncs with top business software products problem-free. Its easy-to-use, versatile payroll system is preferred by accountants and HCM software providers around the country.
Still, Gusto’s popularity doesn’t automatically qualify it as the best payroll software solution for you. Consider factors like how many employees you have, how much growth you’re counting on, which benefits you want to offer and what features you can’t do without while you weigh Gusto against its competitors.
Learn more about Gusto’s pros, cons, features, plans and prices in our Gusto review.
Gusto pros and cons
Gusto is primarily a payroll solution — so if payroll is all you need, Gusto is a fantastic tool. It includes features that many of its key competitors leave out (or include at an extra fee), such as state unemployment insurance management, state new hire reporting, workers compensation integration and wage garnishment.
But if you’re looking for a more complex HR solution, Gusto isn’t the right fit for you. Unlike Paychex and ADP Workforce Now, Gusto doesn’t have employee management tools like a learning management system.
Additionally, while Gusto’s three plans might make it more scalable than single-plan alternatives like OnPay and Square Payroll, its base price and per-employee fee double between the cheapest and mid-tier plan. The price jump might be too much for a small business’s budget.
Gusto pros
Gusto cons
Fully automated payroll.
Limited HR features with cheapest plan.
No additional fees for employee benefit integration.
Health insurance in 37 states only.
Hiring and onboarding tools with each plan.
Expensive higher-tier plans.
Thorough third-party integrations.
Limited customer service with cheapest plan.
International contractor payments in 120+ countries.
Mid-tier plan is double the cost of the entry-level plan.
Gusto’s pricing
Gusto has three main payroll plans:
Gusto Simple costs $40 per month plus $6 per employee.
Gusto Plus costs $80 per month plus $12 per employee.
Gusto Premium requires a custom quote.
Gusto’s plan for contractors costs just $6 per payee for the first six months of service and $35 a month plus $6 per payee for every month after that. Gusto also offers international contractor payments in 120+ countries. The exact fee for global contractor payroll differs from country to country.
Do you need an alternative to Gusto?
The best way to find out if you need Gusto or a Gusto alternative is to try the software yourself. While Gusto doesn’t have a free trial, it does offer free account creation, and you won’t be charged for anything until you run your first payroll. SurePayroll, OnPay and Roll by ADP all offer free trials while the other Gusto payroll competitors on our list provide free demos.
The payroll software you pick impacts how satisfied your employees are with their pay, what benefits you can offer and how much time you spend on payroll each pay period. While signing up for free trials and scheduling multiple demos might sound like a hassle, the time and effort are worth it to find the perfect payroll product.
Consider Gusto for payroll if . . .
You want a payroll-first software solution with some HR tools.
You want payroll software that integrates with most HRIS and HCM software.
You’re comfortable running payroll without dedicated or on-demand customer service.
You want user-friendly software with a low learning curve and plenty of time-saving automations.
Consider a Gusto alternative for payroll if . . .
You need a more robust HR solution, not a streamlined payroll-centric tool.
You want industry-specific payroll software.
You’re part of a large corporation or global enterprise.
You want payroll software with guaranteed nationwide benefits (or global benefits).
Our methodology
To evaluate Gusto and its top competitors, we rigorously assessed each brand according to the following categories:
Pricing, which included factors like lowest and highest listed prices, pricing transparency, extra fees and free trial availability.
Core features, such as unlimited payroll runs, tax service, benefits administration, mobile app access, third-party integrations and more.
Ease of use, which included factors like workflow automations, overall user friendliness, scalability, employee self-service portals and more.
Customer service, which included factors like dedicated account managers, 24/7 availability, response times and more.
We tested each product for ourselves whenever possible by setting up free accounts and scheduling demos. Our hands-on experience was a pivotal part of assessing each brand, determining use cases and evaluating a product’s overall efficacy. We also took verified user reviews into account to make sure more experiences than our own were reflected in our review.
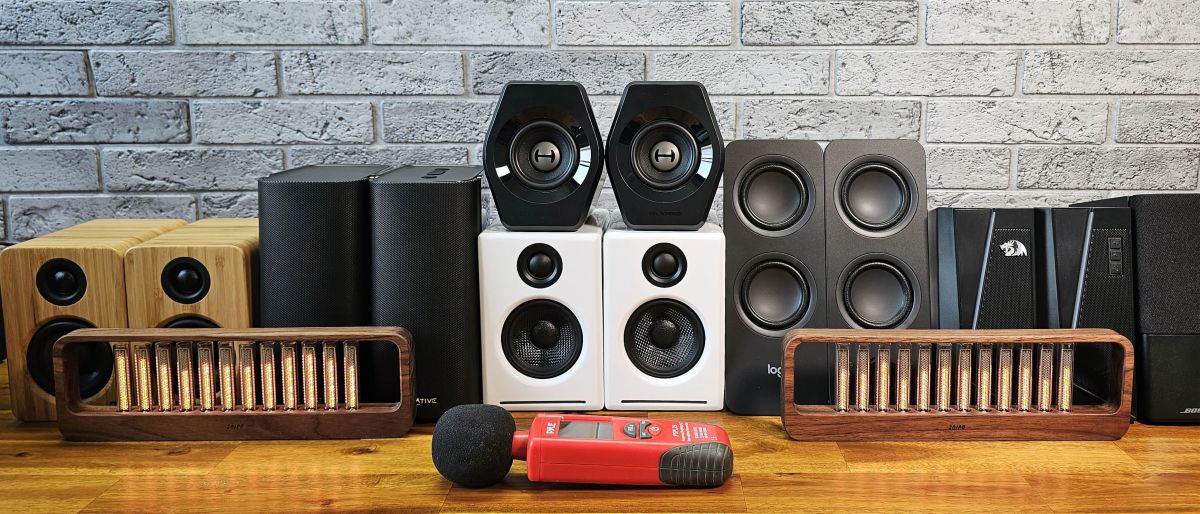
There are plenty of audio options for getting sufficient sound out of your PC. If you’re a laptop user with basic productivity needs (with occasional YouTube excursions), your built-in speakers might be fine. And for those who don’t want to disturb those around them, the best gaming headsets and earbuds can deliver everything from the basics to audiophile-grade excellence. But whether it’s for serious gaming or listening to music with a decent level of volume and quality, it’s tough to beat the freedom, flexibility and audio fidelity of a good set of PC speakers.
But what makes the best PC speakers for you depends on your needs, how much you want to spend and, in some cases, how much available space you have on and around your desk. We’ve tested several current PC speakers, from budget-priced 2.0 options to glorious gaming setups with subwoofers and surround sound, and plenty of options in between.
We’ve gathered the best speakers we’ve tested below, with options starting below $100. And if you aren’t quite sure what kind of speaker setup is best for you, be sure to check the section on what to consider, below our best PC speaker picks.
Quick List
Best Under $100
Best PC Speakers Under $100
Slim, glossy speakers that get loud (without compromising audio quality), have multiple connectivity options, and come with a wireless remote.
Read more below
Best Budget
Best Budget Speakers
Compact, pebble-shaped speakers that can be powered by a standard USB port and sound very good for their budget-friendly price point of $60.
Read more below
Premium 2.0
Best Premium 2.0 Speakers
Attractive, well-built speakers with multiple connectivity options and excellent audio quality.
Read more below
Best 2.0 Gaming
Best Premium 2.0 Speakers
Attractive, well-built speakers with multiple connectivity options and excellent audio quality.
Read more below
5.1 Surround
Best 5.1 Surround Speakers Impressively loud, gamer-oriented 5.1 surround system with wireless rear satellites and attractive lighting.
Read more below
Best Soundbar
6. Creative Sound Blaster Katana SE
Best Soundbar
Powerful but compact gamer-oriented soundbar designed for all/any gaming setup.
Read more below
Best PC Speakers
Why you can trust Tom’s Hardware Our expert reviewers spend hours testing and comparing products and services so you can choose the best for you. Find out more about how we test.
The Best PC Speakers Under $100
(Image credit: Tom’s Hardware)
1. Creative T100
The Best PC Speakers Under $100
Specifications
Speaker Type: 2.0
Frequency Response: 50 Hz to 20,000 kHz
Power Rating: 40W (80W peak
Dimensions: 8.2 x 3.6 x 5.1 inches / 208.28 x 91.44 x 129.54mm x2
Inputs: 3.5mm analog, TOSLINK Optical, Bluetooth 5.0
Reasons to buy
+
Excellent sound for the money
+
Versatile connectivity
+
Included remote
Reasons to avoid
–
Boring, glossy plastic design
–
No USB output
If you don’t mind the boxy black plastic design and don’t want a subwoofer or 5.1 surround sound, Creative’s T100 speakers are arguably the best value in PC audio, often selling for around $80. The pair of speakers stands just over 8 inches tall, and they deliver sound quality and volume output that rivals or bests some speakers that cost more than twice as much. Plus, the T100s come with a remote and ample connectivity options, features that most pricier options lack.
In our testing, the T100 speakers registered an impressive 82.5 dBA at 50% volume, and at 90.4 dBA cranked all the way up, they were among the loudest pair of 2.0 desktop speakers we tested. The Bose Companion 2 got somewhat louder at 91.6dBA, but those speakers have fewer features and cost nearly twice as much, at $149.
Image 1 of 6
(Image credit: Tom’s Hardware)
(Image credit: Tom’s Hardware)
(Image credit: Tom’s Hardware)
(Image credit: Tom’s Hardware)
(Image credit: Tom’s Hardware)
(Image credit: Tom’s Hardware)
For those who want to do more than just play audio from their PC via a standard 3.5mm audio cable, the T100 speakers include Bluetooth 5.0, a USB port for directly plugging a drive to play MP3 and FLAC files, and even an optical connection. Controls on the top of one of the speakers lets you change inputs, adjust volume, and power the speakers on or off, while a wireless remote lets you do all that, plus switch between EQ presets, adjust bass and treble, and more.
Aside from their uninspired glossy black-plastic shells, the only real downside of Creative’s T100 speakers is that they can’t connect over USB. Also, there’s no option for adding a subwoofer. But if you’re shopping in this price range you probably aren’t seriously considering a 2.1 system with extra low-end thump. Sure, you can buy speakers that look and sound better than Creative’s T100, but you might have to spend more than twice as much for substantially better options.
Dimensions: 4.8 x 4.8 x 4.6 inches / 123 x 123 x 118mm x2
Inputs: 3.5mm analog, USB-C, Bluetooth 5.3
Reasons to buy
+
Very budget-friendly
+
Small/compact
+
Attractive minimalist design
+
Powered by USB port
Reasons to avoid
–
Designed to sit on a desk and nowhere else
–
No subwoofer/subwoofer port
The Creative Pebble Pro is the most premium product in the Pebble lineup — but at $60, it still retails for $20 less than the T100’s average sale price. There’s a lot to love about the Pebble lineup in general, starting with its compact and stylish round “pebble” shape, with drivers that are angled upward 45 degrees so the sound hits your ears when they’re placed on a desktop.
The Pebble Pro improves upon the original Pebbles with a higher power output and larger, re-engineered 2.25-inch drivers. It doesn’t have a subwoofer, but its low end gets a boost with Creative’s “BassFlex” technology; it also features the brand’s “Clear Audio” processing technology, which enhances vocals over ambient sound effects in movies, shows, and games. Finally, the Pebble Pro features RGB lighting around the base of each speaker — it’s semi-customizable; you can pick from three basic effects and multiple colors.
Like the original Pebble, the Pebble Pro can be powered by a standard USB port on a laptop — so this is a great set of speakers for those who want a less complicated setup. Unlike the original Pebble, the Pebble Pro has a USB-C PD port that, when plugged into a 30W USB-PD power brick, kicks the Pebble Pro’s power output up to 30W RMS (60W peak). These speakers sound pretty good at their regular power level, but they sound even better (and louder) with the power boost. Plus, as of this writing, if you buy the Pebble Pro on Creative’s website, you’ll get a 30W PD adapter free of charge.
The Pebble Pro boasts impressive audio for its size and price point — though it does lack the lows you’ll get with a subwoofer (or even some larger 2.0 systems). It also gets pretty loud: it registered 69.4dbA at 50% volume in our testing, and 88.2dBA at 100% volume (and distortion was minimal until around 78% volume). The Pebble Pro also offers 3.5mm analog, USB-C, and Bluetooth 5.3 connectivity, and also has 3.5mm headset and microphone jacks.
The main downside to the Pebble Pro might be, coincidentally, its price — Creative’s Pebble V3 has the same drivers (though the Pebble Pro’s are “re-engineered”), Clear Dialog audio processing, and connectivity options as the Pebble Pro, and retails for just $40 (though we recently saw it on sale for $35). Plus, the Pebble V3 comes in the more standard color options of black or white, though it doesn’t have the Pebble Pro’s optional power boost or RGB lighting.
Read:Creative Pebble Pro Review
Best Premium 2.0 Speakers
(Image credit: Tom’s Hardware)
3. AudioEngine A2+
Best Premium 2.0 Speakers
Specifications
Speaker Type: 2.0
Frequency Response: 65 Hz to 22,000 kHz
Power Rating: 30W (60W peak)
Dimensions: 6.25 x 4.2 x 5.6 inches / 158.75 x 106.68 x 142.24mm x2
Inputs: 3.5mm analog, micro USB, RCA, Bluetooth 5.0 (aptX)
Reasons to buy
+
Great sound
+
Excellent build quality
+
Loads of inputs and outputs
+
Aptx Bluetooth
Reasons to avoid
–
Expensive
–
Speaker stands needed for ideal audio experience
–
Exposed drivers aren’t ideal for everyone
At $269, Audiengine’s A2+ speakers are expensive – especially for a 2.0 setup. But they’re also an investment in excellent audio, and one that I’ve personally experienced. I bought the A2 (non-Bluetooth) version of these speakers in 2012, and they still look and sound as good as new. The A2+ model we tested for this page takes the premium build and good looks of the A2 and adds Bluetooth 5.0, with aptX for improved latency (important when watching movies and, perhaps, when gaming competitively).
The A2+ speakers come in an extremely solid-feeling glossy speaker shell, in white, black or red. Ports include pretty much everything you could ask for. You get micro USB for connecting using the speakers’ internal dac or 3.5mm for analog connections. There is a volume knob, a button for Bluetooth pairing and four RCA jacks, two in and two out. The former can be used for adding a subwoofer down the line should you want more bass. But in 10 years using the older A2 model at my treadmill desk, I’ve never felt a real need to add extra thump. If these speakers are your primary sound boxes, though, you may feel differently.
In our testing, the Audioengine A2+ didn’t get as loud as some speakers that cost quite a bit less. And that’s not surprising given they are only rated to output 60W of peak power in total. But they still managed to deliver 85.6 dBA at max volume in our testing, and 78.2 dBA at 50% volume. That’s a lot of sound unless you’re trying to fill a very large room with booming audio, in which case you should consider something larger (Audioengine has you covered there with its A5+ speakers).
Image 1 of 5
(Image credit: Tom’s Hardware)
(Image credit: Tom’s Hardware)
(Image credit: Tom’s Hardware)
(Image credit: Tom’s Hardware)
(Image credit: Tom’s Hardware)
There are two main downsides to Audioengine’s A2+: The exposed speakers aren’t ideal for homes with small children and/or curious pets, who could ruin your audio day with an errant smack or poke. Also, as the design of these speakers is a traditional straight rectangular cabinet, the speakers fire in a straight line, meaning your ears will miss the sweet spot of audio delivery if they’re sitting several inches below your ears on the desk in front of you. This can be fixed by picking up a pair of $20-$30 angled speaker stands or foam wedges, but for this price I would like to see these included in the box as most desktop setups basically necessitate their use to truly appreciate the sound these speakers are capable of.
Best 2.0 Gaming Speakers
(Image credit: Tom’s Hardware)
4. Edifier G2000
Best 2.0 Gaming Speakers
Specifications
Speaker Type: 2.0
Frequency Response: 98 Hz to 22,000 kHz
Power Rating: 16W (32W peak)
Dimensions: 5.12 x 4.13 x 4.2 inches / 384.05 x 104.9 x 50.8mm x2
Inputs: 3.5mm analog, USB-A, Bluetooth 5.1
Reasons to buy
+
Solid sound, with subwoofer option
+
RGB lighting
+
USB, Bluetooth, analog connectivity
+
Aux port for subwoofer
Reasons to avoid
–
Annoying startup sound (that can be turned off)
–
Side controls could be more intuitive
–
Outer shell shows off smudges
Any set of speakers can deliver the blasts, booms or pickaxe bloops of your favorite PC game. But if you’re after a compact and relatively affordable set of speakers that will make your games sound good (while delivering some gamer style in the process), Edifier’s G2000 speakers are a great choice. The pair of speakers won’t take up much space on your desk, and they deliver a surprising amount of sound – with an emphasis on the low end. Don’t expect room-shaking rumble here, but with a subwoofer port at the back of one of the speakers, these small speakers can grow with your gaming needs.
Edifier’s G2000 speakers also offer up a plethora of connectivity options. Around the back there’s USB connectivity, 3.5mm analog, and Bluetooth 5.2 is an option if you want to go wireless. For those who crave a little light show to go along with their games, the speakers also offer up some RGB, with light emanating from slits on either side and a panel at the back (to reflect off of your wall). Just note that the lights are controlled via buttons on the side of one of the speakers, with 12 available settings. So don’t expect the kind of flexibility you might get from software controls.
Note that these aren’t the best option for listening to music, as each speaker consists of one 2.75-inch driver that has to do double-duty, handling the highs and lows. But if you don’t mind their bias toward the bass end of the spectrum, they’re OK for most audio tasks other than gaming. Just know that the G2000s are tuned and designed for those who prioritize gaming. If that sounds like you and you don’t want to spend more than around $110, these speakers are a great option. And if you don’t like basic black (and gray), there are pink, red, and white color options available for $5-$10 more.
Best 5.1 Surround Speakers
(Image credit: Tom’s Hardware)
5. SteelSeries Arena 9
Best 5.1 Surround Speakers
Specifications
Speaker Type: 5.1
Frequency Response: 35 Hz – 20,000 Hz
Power Rating: 280W Peak
Dimensions: 7.72 x 4.13 x 4.97 inches / 196.1 x 104.9 x 126.2mm x2 (front) 6.49 x 4.19 x 4.41 inches / 164.8 x 106.4 x 112mm x2 (rear) 3.93 x 3.85 x 9.6 inches / 99.8 x 97.8 x 243.8mm x1 (center) 12.8 x 9.25 x 9.17 inches / 325 x 235 x 233mm x1 (subwoofer)
Inputs: 3.5mm analog, USB-C, optical-in, optical passthrough, Bluetooth 4.2
Reasons to buy
+
Very powerful
+
Fantastic audio
+
True surround
Reasons to avoid
–
Expensive
–
Takes up a lot of space
SteelSeries says its Arena 9 is the first 5.1 surround system for gaming, which we suppose is technically true, because while there are other 5.1 surround systems for PCs, they’re not billed as being gamer-oriented. The Arena 9 comes with five satellites — a center channel that sits under your monitor, two left/right front channels, and two left/right rear channels — as well as a 6.5-inch down-firing subwoofer. The rear satellites are wireless (they connect to each other and are powered separately, but connect to the system wirelessly), which makes for an easier setup than trying to run speaker cables under carpeting.
The Arena 9 comes with a handy control pod, which features an informative OLED display and touch-sensitive buttons. You can control most of the Arena 9’s features, including audio settings such as EQ and 5.1 upmix, lighting settings such as color mode and brightness, and system settings such as Bluetooth and rear speaker pairing, with this control pod, which is weighted so it will stay on your desk. For further customization, the Arena 9 also works with SteelSeries’ GG software, which includes the company’s Sonar audio app with parametric EQ.
Image 1 of 12
(Image credit: Tom’s Hardware)
(Image credit: Tom’s Hardware)
(Image credit: Tom’s Hardware)
(Image credit: Tom’s Hardware)
(Image credit: Tom’s Hardware)
(Image credit: Tom’s Hardware)
(Image credit: Tom’s Hardware)
(Image credit: Tom’s Hardware)
(Image credit: Tom’s Hardware)
(Image credit: Tom’s Hardware)
(Image credit: Tom’s Hardware)
(Image credit: Tom’s Hardware)
There’s nothing quite like true surround sound in movies and games that support it, and the Arena 9 does an excellent job of delivering immersive, directional audio that will make certain games come alive. (For audio sources that don’t support surround, the Arena 9 offers 5.1 upmixing, which converts stereo sound into multi-channel audio.) But even stereo sources sound great on the Arena 9, with clear, solid mids and nicely-rendered lows (thanks to the hefty subwoofer).
The biggest downside to the Arena 9 is definitely its high price point of $550 — especially when you can find budget-priced home theater surround systems for under $400. But the Arena 9 really is designed for PC gamers with its USB connectivity — other similarly-priced home theater surround systems aren’t designed to work directly with PCs. The Arena 9 also has some nice features that are specifically designed for PC gamers, such as 4-zone immersive lighting and a desktop control pod (versus, say, a remote).
Best Soundbar
(Image credit: Tom’s Hardware)
6. Creative Sound Blaster Katana SE
Best Soundbar
Specifications
Speaker Type: Soundbar
Frequency Response: 55 – 20,000 Hz
Power Rating: 90W RMS (180W Peak)
Dimensions: 3.1 x 25.6 x 4.3 inches / 78 x 650 x 109mm x1
Inputs: 3.5mm analog, USB-C, HDMI ARC, optical-in, Bluetooth 5.0
Reasons to buy
+
Sleek compared to speakers
+
Pretty lighting that you can see
+
Lots of connectivity options for both PC and TV
Reasons to avoid
–
Uninspired display
–
No subwoofer
Soundbars are usually thought of as TV/home theater accessories, but they’re a good option if you’re limited on lateral desk space — and there are a few that are designed specifically with PC users in mind. The Sound Blaster Katana SE is Creative’s most recent addition to its gaming-oriented Katana lineup, and it’s particularly suited to a setup with limited space, as it’s the first Katana soundbar without a subwoofer.
The Katana SE is slim enough at just 3.1 inches (78mm) high to fit neatly under your desktop monitor — though it also comes with custom wall-mounting hardware for those who want to mount it under a monitor or TV. It features four drivers — two 4.3-inch (109mm) midrange drivers, and two 2.1-inch (54mm) tweeters — each of which is individually powered by dual DSP-controlled stereo amps. The result is clear, great-sounding audio and a soundbar that gets impressively loud: while the Katana SE managed a maximum of 74.5dBA at 50% volume in our testing, it hit a significantly higher maximum of 92.7dBA at 100% volume.
The Katana SE is packed with features and connectivity for all types of gamers — it features the typical 3.5mm analog and USB-C inputs, as well as optical-in, HDMI ARC, and Bluetooth 5.0. It also has a Dolby Audio decoder (available over HDMI ARC/optical-in), as well as Creative’s Super X-Fi headphone technology for virtual surround sound. Its multiple input ports means you can use it with your PC as well as consoles, TVs, and other devices — making it much more versatile than Razer’s Leviathan V2 and V2 Pro soundbars, which only offer connectivity via USB and Bluetooth.
While the Katana SE sounds very good, even at the low end, it doesn’t quite offer the deep, weighty bass reproduction of a dedicated subwoofer. Creative’s Sound Blaster Katana V2 soundbar retails for just $30 more (though it’s currently on sale for the same $300 price tag as the Katana SE), and comes with a slim, 6.5-inch subwoofer, for those who have some under-desk space.
What to Consider While Shopping for PC Speakers
✳ Stereo, subwoofer, or surround: A basic 2.0 speaker setup has just two speakers (a left channel and a right channel), and won’t take up too much space on (or under) your desk, provided you don’t opt for bulky, powered bookshelf speakers. If you want something with a more powerful bass response, you should look for a 2.1 system, which comes with a separate subwoofer. (You can also purchase a subwoofer separately, so long as it’s compatible with your setup).
If you’re looking to replicate the immersiveness of home theater audio, you’re probably looking for a 5.1 (or higher) surround sound setup. Just know that these speaker sets tend to be expensive, and you may have to do some creative speaker placement and wire routing to keep your PC from looking like some kind of low-budget Spider-Man movie set.
✳ How you’ll connect to your PC: There are a few different ways to connect speakers to your PC. Some speakers, usually higher-end models, connect via USB. This makes them easy to plug into most PCs and laptops, and they use their own built-in DAC/sound card, so you won’t have to worry about the quality of your system’s onboard audio. Not all speakers have this option, however — many are analog-only, which means you’ll need to connect them directly to your motherboard’s analog hookup or your laptop’s headset jack. This shouldn’t be too much of an issue for 2.0 systems, but if you’re looking at 2.1 or 5.1 surround, you’ll want to make sure your PC’s built-in audio can support it (or purchase a separate internal or external sound card).
✳Bluetooth: Bluetooth speakers are a category all on their own, and they’re not very well-suited to acting as desktop PC speakers (nor are they very economical if you don’t need the portability). Bluetooth isn’t a necessity in PC speakers, but the added versatility can be a bonus — especially if you frequently switch between systems and/or devices.
✳Where you’ll put them: Many PC speakers are, perhaps not surprisingly, designed to be placed on your desktop — and some are even angled upward for optimal audio delivery to your ears. But if you’re thinking of putting your speakers elsewhere — on the floor, a shelf, or even mounted to the wall — make sure the speakers’ stands allow for varying placement (or are removable).
And note that you may have to buy stands for ideal placement or angling, as many PC speakers don’t come with them. Some models attempt to help angle the sound up toward your ears by building the angle into the design of the housing, but this can lead to complications if, for some reason, you need or want to place the speakers above your desk surface.
✳ Size: As is obvious to anyone who’s ever had more than a passing interest in high-end audio, speakers come in all kinds of shapes and sizes. And outside of hi-fi focused options that require a separate amplifier for power, there are also several powered bookshelf speakers that function much like PC speakers, in the sense that you can just plug them into an outlet and then into your PC (or connect wirelessly over Bluetooth).
But as these bookshelf speakers often stand close to a foot tall and are several inches wide and deep, they don’t make ideal desktop speakers for most people. They also tend to pump out more sound than is comfortable for most people when sitting right in front of you. They can, however, be a good option for impressive PC audio if placed behind out – on, say, a bookshelf.
More traditional desktop speakers can also vary pretty dramatically in size, from tall and thin towers to compact, to compact rounded designs, to boxier and somewhat bulkier options that mimic the shape of larger, traditional bookshelf speakers. Be sure to consider how much space you have on your desk before buying. But know that (often though not always) speakers with larger drivers and more solid cabinets can pump out more and better sound, and are less likely to vibrate or otherwise move around on your desk. In other words, don’t expect to be blown away by tiny, inexpensive speakers (in most cases).
How We Test Speakers
A lot of opinions about sound signature, features, and design come into play when deciding what PC speakers are the best for you. Of course, there are measurable characteristics that can tell you quite a bit about how a set of speakers sound. But without thousands of dollars of equipment and an anechoic chamber, it’s tough to reliably make those kinds of measurements. Plus, regardless of what those results might be, how speakers will sound to you depends greatly on the size and shape of your room, the types of materials on and around your walls, and your own ears and brain.
So without unlimited space and funds for true high-end audiophile-level testing, or the ability to take everyone’s physiology and computing surroundings into account, we’ve attempted to mix some measurable data with lots of experience and our own opinions when testing speakers.
We use a Pyle PSPL25 sound meter at a fixed 1-meter distance to test a speaker’s maximum sound output at 50% and 100% volume, using a standard test track. This tells us both how loud a set of speakers can get, and how good or bad things sound when cranked all the way up. Cheaper speakers (and some more expensive options with sub-par power supplies) don’t tend to sound great at max volume. We also use the speakers across a range of common PC tasks: playing games, watching video, and listening to music to get both an anecdotal sense of how the speakers sound in everyday use, as well as how intuitive any hardware or software controls are to navigate.
As with all of the products we benchmark, test, and review, how we test speakers is a fluid process, aimed at delivering useful results and suggestions for our readers. Please feel free to offer up suggestions in the comments below. When we make substantive changes to how we test speakers, we’ll update this portion of the page.
As an accountant, you need payroll software that syncs with your clients’ existing accounting software, automates as many aspects of payroll as possible, and simplifies tax season. You also need user-friendly payroll software that easily accommodates data from multiple clients while reducing the possibility of user error.
SEE: The four best free payroll software options available in 2023.
Each option on our list of the best payroll software for accountants meets those requirements and then some. Keep reading to find the right software for your unique accounting and payroll needs.
Jump to:
Top payroll software for accountants feature comparison
Whether you’re part of an in-house accounting team or you manage multiple client accounts at your accounting firm, your payroll software should accurately file taxes and calculate paychecks so you can keep your clients’ business finances in line. Ideally, CPA payroll software also helps you communicate complicated financial concepts to non-accountant business owners.
Learn more about the features to look for in payroll software for accountants in our comparison chart below.
Full-service tax filing
Professional account migration
Accounting software integrations
Accountant partner pricing discounts
Free marketing material
Starting monthly price
QuickBooks Payroll
Yes (Elite plan only)
QuickBooks Online
Yes
No
$45 plus $5 per employee
OnPay
Yes
Yes
QuickBooks, Xero
Yes
Yes
$40 plus $6 per employee
Gusto
Yes
Yes (Premium plan only)
QuickBooks, Xero, FreshBooks, Sage, and more
Yes
Yes
$40 plus $6 per employee
Paychex Flex
Yes
Yes
QuickBooks, Xero, Sage, and Oracle NetSuite
Yes
Yes
$39 plus $5 per employee
Rippling
Yes
Yes
QuickBooks, Xero, Sage, and Oracle NetSuite
Yes
Unlisted
Custom quote only
Patriot Payroll
Yes (full-service plan only)
Yes
Patriot Accounting, QuickBooks Online
Yes
Free co-branding
$35.15 + $3.80 per employee
RUN Powered by ADP
Yes
Yes
QuickBooks, Sage, Xero, Wave
Yes
Yes
Custom quote only
QuickBooks Payroll: Best overall
Image: Intuit QuickBooks
Our star rating: 3.6 out of 5
QuickBooks Payroll, Intuit QuickBooks’ payroll product, includes the full spectrum of features accountants need to process payroll for their clients. Most notably, each plan includes full-service payroll, next-day direct deposit and optional add-on healthcare benefits (available in every U.S. state except Hawaii and Virginia). Like Gusto Payroll, Paychex and other payroll software services, QuickBooks Payroll mails out 1099 and W-2 forms at the end of the year and includes an autopilot feature that lets you schedule payroll in advance.
QuickBooks Payroll’s biggest benefit is its seamless integration with Intuit QuickBooks Online, one of the most widely used accounting software tools in the world. Since QuickBooks Online was made with non-accountant, small business owners in mind, many of your clients likely use it already, which can make them feel more comfortable adding payroll software to their roster.
Pricing
Accountants who partner with QuickBooks Online Payroll are known as QuickBooks ProAdvisors. Through the QuickBooks ProAdvisor Preferred Pricing program, you can choose to have QuickBooks bill your accounting firm directly at a discounted rate, or you can pass savings along to your client with a year-long ProAdvisor discount.
Without the QuickBooks ProAdvisor discount, QuickBooks Online Payroll pricing is as follows:
Core costs $45 a month plus $5 per employee per month.
Premium costs $75 a month plus $8 per employee per month.
Elite costs $125 a month plus $10 per employee per month.
New customers can choose a 30-day free trial or waive the free trial to get 50% off for three months. (The discount applies to the base price only, not the per-employee fee.)
Features
Automatic next-day direct deposit with QuickBooks Payroll Core or same-day direct deposit with all other plans.
Optional employee benefit add-ons including healthcare and 401(k) plans.
Automatic wage garnishment deduction.
PTO management.
Pros
Preferred partner discounts for both QuickBooks Payroll and QuickBooks Online.
Problem-free syncing with QuickBooks Online.
No additional fee for state and federal payroll tax filing. (Additional fee for local tax filing.)
Comprehensive payroll features on a streamlined, user-friendly platform.
Cons
No workers’ compensation administration with QuickBooks Payroll Core.
White-glove setup only available with QuickBooks Payroll Elite, the most expensive plan.
Limited human resources features, tools and support.
For more information, read our full QuickBooks Payroll review.
OnPay: Best free data migration
Image: OnPay
Our star rating: 4.2 out of 5
OnPay’s thorough blend of payroll and HR features makes it the ideal payroll software solution for businesses that want one all-inclusive service to manage employee pay and benefits. Along with unlimited monthly payroll runs, OnPay offers employee self-service onboarding tools, automatic state new-hire reporting and access to a generous HR library that helps business owners stay legally compliant.
If you or your client switches to OnPay from another payroll provider, OnPay’s in-house team of experts will set up the software for you to ensure accuracy during the transition. OnPay has the added benefit of syncing with QuickBooks Online, QuickBooks Desktop and Xero, another of the most popular accounting software programs for enterprises.
Pricing
If you partner with OnPay to manage your clients’ payroll, you can use OnPay’s payroll service for free for your own firm. Additionally, once you have at least three clients, you’ll qualify for software discounts you can pass along to those clients.
Outside of partner pricing discounts, OnPay charges a flat fee of $40 a month plus $6 per employee per month. Every new client can use OnPay free for one month.
Features
Specialized payroll plans for businesses in niche industries, including payroll for nonprofits, restaurants, farms, churches and enterprises.
Workers’ compensation administration in all 50 U.S. states.
Healthcare and dental insurance benefits in all 50 U.S. states.
Direct deposit, paper check and prepaid debit card employee pay options.
Pros
Free marketing tools for your accounting firm.
Free migration and white-glove account setup.
Upfront flat-fee pricing with no hidden fees.
Free multi-state payroll runs.
Integration with most popular time tracking software tools.
Cons
One plan only, which limits scalability for growing businesses.
No international payroll or HR features, including for employees based in U.S. territories.
For more information, read our full OnPay review.
Gusto: Best for versatile accounting software integrations
Image: Gusto
Our star rating: 4.1 out of 5
Gusto is one of the most-used payroll services in the United States. Unlike QuickBooks Payroll, Gusto Payroll integrates with multiple accounting software tools for small businesses and enterprises alike. Whether you or your clients use Aplos, Bookkeeper360, AccountingSuite, Ignition, Paperclip, Sage Accounting, Xero, FreshBooks or a host of other accounting, ERP and HCM solutions, you can sync that software seamlessly with Gusto.
Pricing
As long as you onboard at least one new client to Gusto per year, your accounting firm can use Gusto’s Plus plan for free in-house. If you have three or more clients, you qualify for product discounts that range from 10% to 20%.
While each of Gusto’s three plans have the same payroll features, the higher-priced plans include far more HR resources:
Simple costs $40 a month plus $6 per employee per month.
Plus costs $80 a month plus $12 per employee per month.
Premium has exclusive pricing only.
Gusto doesn’t advertise a free trial on its site, though many third-party sites report that Gusto does offer one.
Features
Free marketing collateral for Gusto-partnered accounting firms.
Next-day direct deposit with Gusto Simple and same-day direct deposit with all other Gusto plans.
Optional employee health insurance benefits and administration in 37 U.S. states.
Hiring and onboarding tools, including offer letter templates and employee self-onboarding features.
Pros
International independent contractor payments (for an additional fee).
Built-in time tracking (not available with the cheapest plan).
Automatic pre-scheduled payroll runs.
Custom admin workflows and permissions with each plan.
Cons
Compliance alerts, HR resource library and HR expert access limited to the most expensive plan only.
Health insurance limited to 37 U.S. states.
For more information, read our full Gusto review.
Paychex Flex: Best accountant-specific resource library
Image: Paychex
Our star rating: 3.5 out of 5
Paychex Flex has more perks for accounting firms than almost any other payroll software program. Paychex’s accountant partners can access Paychex’s comprehensive accountant knowledge center (which includes resources like the U.S. Master Tax Guide), free accountant publications and an extensive end-of-year resource center. Paychex also offers online courses and webinars for accountants who want to earn free continuing professional education credits.
Other Paychex resources for accountants include direct access to a dedicated Paychex HR team, who can help you answer your clients’ questions about hiring and labor laws. If you want to position your firm as an expert in general business consulting, Paychex can give you the tools to do so.
Pricing
Paychex doesn’t advertise any discounts that Paychex-affiliated accountants can pass along to their clients. Additionally, while Flex has three separate payroll plans, it only lists pricing for its cheapest plan online:
Paychex Flex Essentials costs $39 a month plus $5 per employee per month.
Paychex Flex Select and Paychex Flex Pro require custom pricing quotes.
Paychex’s free trial of three months is longer than most other free trials in the industry.
Features
Thorough HR and payroll educational resources for accountants to pass along to their clients.
Automatic payroll tax calculation and filing with on-demand assistance from a dedicated Paychex representative.
Employee- and employer-facing apps with self-service portal and self-guided onboarding.
HR library access for both accountants and their clients.
Automatic state new-hire reporting.
Pros
Thorough suite of accountant-specific benefits, including access to a comprehensive knowledge center.
Extensive compliance updates and support.
Three-month free trial for most new clients.
24/7 customer support.
Cons
Limited pricing transparency.
Additional fee for accounting software integration and wage garnishments.
For more information, read our full Paychex review.
Rippling: Best for global payroll management
Image: Rippling.com
Our star rating: 3.8 out of 5
Rippling is a fully featured global HR, IT and payroll solution. Unlike both OnPay and QuickBooks Payroll, Rippling supports international payroll, including payments to both contractors and in-house employees (in contrast, Gusto only supports international contractor payments.) Rippling is also the only payroll and HR software on our list to provide remote tech management. Its IT module lets businesses configure business software from afar, which makes it a good choice for accounting firms whose clients are enterprises with remote, global workforces.
Pricing
In order to build a customized Rippling package, you have to first start with Rippling’s software platform, Rippling Unity, which costs a monthly base fee of around $35. From there, you can add whichever Rippling modules you want, from payroll to remote tech management. Each module costs an additional per-employee fee, so Rippling’s costs might add up too quickly for small businesses with tight budgets.
Features
Thorough payroll automation and integration with native time and attendance software.
Employee benefits administration.
Remote app and employee device management.
Corporate cards and employee expense management.
Pros
Dedicated Rippling support team for accountants only.
Comprehensive HR, IT and payroll management from one streamlined platform.
Multiple safeguards to minimize the potential for human error during data entry.
Cons
No transparent pricing on site.
Limited information about accountant-specific perks available online.
For more information, read our full Rippling review.
Patriot Payroll: Best for small-business payroll
Image: Patriot
Our star rating: 3.8 out of 5
If your accounting firm primarily manages payroll for small and midsize businesses, Patriot Payroll can keep payroll costs low for both you and your clients. While many other payroll providers only offer software discounts once you have five or more clients, Patriot offers a 5% discount for accounting firms right off the bat. Similarly, every accounting firm that works with Patriot gets free co-branding, a benefit that most other payroll systems reserve for firms with at least five clients.
Pricing
Patriot has both a full-service plan and self-service plan, though its site only lists discounted accountant pricing for the full-service plan:
Accounting firms with one to five clients pay $35.15 per month plus $3.80 per employee.
Firms with six to 20 clients pay $33.30 per month plus $3.60 per employee.
Firms with 21 to 50 clients pay $31.45 plus $3.40 per employee.
Firms with 51 to 100 clients pay $29.60 per month plus $3.20 per employee.
Accounting firm clients also save on Patriot’s accounting software. Larger accounting firms with 100+ clients are eligible for deeper discounts.
Features
Fully customizable payroll reports specific to each client.
Payroll and accounting software discounts for accounting firms working with one client only.
Extremely user-friendly dashboard for easily managing hundreds of clients.
Unlimited users, user workflows and admin permissions.
Highly rated U.S.-based customer support.
Cons
Extremely limited human resource tools.
No healthcare benefits administration options.
Accounting software integration limited to QuickBooks Online or Patriot’s proprietary software.
No mobile payroll app.
For more information, read our full Patriot Payroll review.
RUN Powered by ADP: Best for growing accounting firms
Image: ADP
Our star rating: 3.9 out of 5
Most payroll software companies offer marketing perks to partnered accounting firms, but ADP’s marketing tools are a cut above. Its free resources include marketing brochures, customizable videos and firm profiles on sites like TaxBuzz and CountingWorks. Accounting partners can also use the CountingWorks Pro Marketing Suite to establish a company newsletter, create a comprehensive website and learn how to communicate better with clients.
Like Paychex, ADP helps accountants register for continuing professional education courses. It also ensures access to IRS credit courses that likewise boost your business’s credibility and expertise.
Pricing
ADP doesn’t list any pricing information online. To learn how much RUN Powered by ADP costs and whether the company offers accounting partner discounts, contact ADP directly to request a quote.
Features
Automatic paycheck calculation, tax filing and state new-hire reporting.
HR tips, checkups and newsletters with every plan.
Built-in time and attendance software with automatic payroll syncing.
Pros
HR features included with every payroll plan.
Well-reviewed mobile app for employees and employers.
Add-on benefits like retirement accounts, healthcare and workers’ compensation administration.
Cons
No transparent pricing online.
Compliance alerts and HR database only available with pricier plans.
Additional charge for W-2 and 1099 delivery.
For more information, read our full ADP review.
Key features of payroll software for accountants
At bare minimum, all accounting payroll software should include free unlimited payroll runs, paycheck calculation, tax filing, direct deposit and employee pay stub access. But the best payroll software for accountants should go above and beyond the basics to offer perks specific to accounting firms. Whether you manage one client or hundreds, look for a payroll solution that prioritizes the following features and services:
Professional account migration or white-glove setup
Your clients will likely need your help moving their payroll data from their old payroll system to your system (or with setting up payroll for the first time if they’ve just hired an employee.) While you can take care of data migration by hand, it’s a time-consuming process that requires a good deal of oversight to reduce errors.
The top accountant payroll providers should offer free data migration services, meaning their team will set up your clients’ payroll software on your behalf. This professional setup should include multiple quality checks to mitigate the possibility of introduced errors.
Accounting software integration
Your payroll software should be completely compatible with your preferred accounting solution. The two should sync automatically and update in real time. Otherwise, you risk sharing inaccurate data with your client. Additionally, if you have to enter financial payroll data into your client’s general ledger by hand, you’ll need to double- and triple-check that you entered the data accurately.
Most payroll software syncs with at least one accounting solution and all of the most popular accounting payroll products integrate seamlessly with QuickBooks Online. If you or your clients use accounting software other than Intuit QuickBooks, make sure it integrates with your payroll service of choice.
Completely automated full-service payroll
When you’re juggling multiple clients with different pay schedules, software with automatic payroll runs, fully automated direct deposit and autopilot or one-touch payroll processing can save you hours of time. To free up time for more important accounting tasks, look for payroll systems that thoroughly automate most, if not all, payroll processes.
Discounts and promotional material for accounting partners
Whenever you onboard a new client, you aren’t just bringing in more business for your firm: You’re also bringing your payroll provider a new customer and source of income. The best payroll software companies will treat you like a true partner, offering discounts (or freebies like letting your firm use the software for free), promotional material and other accountant-specific benefits.
Dedicated customer support
Since you’re dealing with multiple client accounts, a problem with your payroll software doesn’t impact just one business owner: It potentially impacts dozens of businesses and hundreds of employees who are counting on you to ensure they get an accurate, timely paycheck.
Instead of routing you to a phone tree or responding only via email, your payroll software provider should have a dedicated customer support team specific to accounting firms. Be wary of any payroll provider that doesn’t advertise its commitment to answering accounting firms’ questions as soon as possible.
Methodology
To find the best payroll software for accountants, we looked at the most popular, best reviewed software on the market. We narrowed down the playing field by assessing each payroll provider’s accountant-specific tools, features, and perks. We looked at verified user reviews, viewed demos and spoke with sales representatives when possible.
How do I choose the best payroll software for my accounting business?
The best payroll software for your accounting business will be versatile enough to meet your firm’s in-house payroll needs while accommodating your clients’ needs as well. It will sync seamlessly with your accounting software so your clients’ financial data is always accurate and up to date. It will fall within both your budget and your clients’ budgets and it should scale to keep pace with the size of your clients’ businesses.
Keep these considerations in mind as you search for the right payroll software for your needs. Don’t be afraid to insist on a demo or free trial before you commit to one payroll provider over another. The payroll software you choose will have a huge impact on your business’s ability to turn a profit as well as your clients’ happiness, so weigh your options thoroughly and ask your sales representative as many questions as possible while making your decision.
Handling a construction project is complex, especially for project managers who have to juggle everything including materials, employees, client expectations and project deadlines. Construction project managers need an efficient way to manage their resources and coordinate all of the tasks associated with their projects. For many teams, the best way to consolidate all of their project plans and increase visibility into individual tasks is to invest in project management software.
Construction project management software helps contractors and subcontractors streamline the process of completing projects on time and within budget. It provides a centralized platform to keep track of tasks, communicate with project teams and stakeholders, store documents and files, and generate reports. The software also offers collaboration capabilities that keep stakeholders connected throughout the project life cycle.
In this product guide, we’ve evaluated seven of the best construction project management software solutions, taking a closer look at their features, costs, pros and cons, to help you determine the best option for your needs and budget.
Jump to:
Top construction project management software comparison
When choosing the best construction management software for your business, you need to consider pricing as well as features. This table shows which construction software includes which features to help you make your decision.
Fieldwire: Overall best for construction project management
Image: Fieldwire
Fieldwire is purpose-built construction project management software that is designed for general contractors, specialty contractors, owners, architects and designers. It offers functionality to help them plan, manage and track construction-specific projects from start to finish, providing the necessary features for successful project delivery.
Fieldwire lets users connect with their teams in real time while managing project tasks, documents and photos. Fieldwire capabilities also include task management, checklists, punch lists, inspections and reports.
Pricing
Fieldwire offers tiered pricing plans, priced depending on your needs and preferences:
Basic: This is a free plan with a limit of five users and three projects.
Pro: $39 per user per month billed annually, or $54 per user per month billed monthly.
Business: $59 per user per month billed annually, or $74 per user per month billed monthly.
Business Plus: $74 per user per month billed annually, or $89 per user per month billed monthly.
Enterprise: This is a quote-based plan. Contact the Fieldwire sales team for custom quotes.
Figure A
Fieldwire dashboard.
Features
Supports real-time communication amongst teams for accelerated decision-making.
Includes team performance tracking to ensure timely task delivery.
Allows users to manage upcoming items with customizable PDF reports that can be scheduled.
Includes all-inclusive features for various types of contractors, including concrete, electrical, plumbing, HVAC, interior finishing and fire-stopping contractors.
Offers platform support for 19 languages; the customer support team is fluent in English, French, Spanish, Portuguese, German, Czech and Italian.
Supports kanban boards, Gantt charts and calendar views.
Pros
Transparent pricing.
Free plan for budget-conscious users.
File sharing and plan viewing.
Multi-device support for Web, Android and iOS.
Real-time push notifications.
Custom form creation.
Cons
Basic and pro plans lack phone support.
API access and single sign-on features are only available in the enterprise plan.
Free trial must be requested instead of being able to sign up immediately.
Jira: Best for task tracking
Image: Atlassian
Jira is an issue-tracking and project management tool for teams of one to 20,000+ users that is based on agile project management methodology. Its versatile software with various features and customizable templates allows users to create their own workflows. With features such as project roadmaps, team collaboration, time tracking, budgeting, document management and analytics reports, Jira ensures teams remain on track throughout the project life cycle.
Although Jira is not specifically designed for construction teams, it offers many features that are helpful for this kind of work. For example, Jira’s hierarchical and Gantt chart elements are ideal for managing more granular and even unplanned administrative project tasks that may arise, such as filing change orders.
In addition, Jira’s Gantt charts come with smart resource risk management add-ons, which can be useful for managing and reallocating project resources when unexpected variables like weather impact project outcomes and schedules.
Pricing
Free: $0 for up to 10 users.
Standard: $7.75 per user per month billed monthly.
Premium: $15.25 per user per month billed monthly.
Enterprise: This plan is quote-based.
Figure B
The Jira dashboard.
Features
Integration with other Atlassian and third-party tools, such as Dropbox, Slack and Microsoft Teams.
Reports and insights capabilities.
Customizable workflows.
Workflow management with scrum and kanban boards.
Project roadmap capability which enables users to define their project goal and vision.
Pros
Integration with over 3,000 apps.
Drag-and-drop automation.
Easy to use and highly customizable.
Cons
Complex initial setup process.
Primarily built for engineering and software development teams, not construction.
For more information, read the full Jira review.
Confluence: Best for collaboration
Image: Atlassian
Confluence is team collaboration software that helps teams to organize and share information, collaborate, plan and track projects in one centralized location. It can be used for various project management needs, including task management, resource management, project timelines and project reporting. It is used by both small and large teams and can be customized to fit their differing needs.
Like Jira, Confluence isn’t specifically designed for construction projects, but it’s especially great for construction companies with offices and remote workforces that are spread out geographically. The platform allows administrators to create collaborative knowledge hubs for sharing the most up-to-date company and team news, not to mention the project spaces and searchable labels users can add to their accounts.
So, whether it’s a worker on a construction site or a back-office team member who manages payroll in another country, each team member can view the company’s feed and find answers to their questions on their own time.
Pricing
Confluence offers one free plan and three paid plans:
Free: $0 for up to 10 users.
Standard: $5.75 per user per month billed monthly.
Premium: $11 per user per month billed monthly.
Enterprise: This plan is quote-based.
Figure C
Confluence dashboard.
Features
Integration with Atlassian software and other third-party tools such as Jira, Trello, Figma, Slack, Dropbox, Box, Google Drive and Microsoft Teams.
Various project management templates, including end-of-week status reports and Atlassian project plans.
Marketing campaign templates for planning and tracking marketing tasks and deadlines.
99.9% and 99.95% uptime service-level agreements available in Premium and Enterprise tier plans, respectively.
Pros
Free plan available.
Mobile app for iOS and Android.
Designed for optimized team collaboration.
Cons
Free and Standard plans have limited support.
Can be expensive for organizations with large numbers of users.
Not specifically designed for construction work.
For more information, read the full Confluence review.
Buildertrend: Best for remodelers
Image: Buildertrend
Buildertrend is a cloud-based construction project management software designed for home builders, specialty contractors, remodelers and commercial contractors. They can use this software to schedule tasks, track progress, manage budgets, keep documents organized and access job site information.
Buildertrend’s software integrates with many popular business apps, such as Quickbooks, Xero and Gusto for payroll and accounting services. It also integrates with the Home Depot Pro Xtra program for purchasing needs. Beyond its integrations and primary feature set, Buildertrend offers a customer portal that allows clients and subcontractors to collaborate on and discuss project progress in real time.
Pricing
Buildertrend offers a special discounted rate for the first month on each of its three pricing plans, which then increases substantially afterwards.
Essential: $99 for the first month, then $399 per month billed monthly; or $339 per month billed annually.
Advanced: $399 for the first month, then $699 per month billed monthly; or $599 per month billed annually.
Complete: $699 for the first month, then $999 per month billed monthly; or $829 per month billed annually.
Figure D
Buildertrend dashboard.
Features
Advanced estimate and bid management.
Ability for users to create requests for information and add photos or documents to the platform.
Integration with various third-party tools, including Quickbooks, Xero and Gusto.
Lead management and proposal capabilities.
Time clock features which enable teams to clock in and out on their phones.
Invoice creation based on estimates.
File annotation capabilities.
Pros
Offers transparent pricing.
Automates email campaigns and tracks lead responses.
Offers a customer portal.
Bills management.
Boasts an A+ rating from Better Business Bureau.
Cons
Steep learning curve.
Lack of a free trial option or a forever free plan.
Expensive pricing plans may cost too much for some small businesses.
Contractor Foreman: Best for contractors and ease of use
Image: Contractor Foreman
Contractor Foreman is an easy-to-use, cloud-based construction project management software that helps contractors and subcontractors manage their entire project life cycle, from estimating and bidding to project scheduling and job costing.
The tool is intuitive and user-friendly, allowing users to manage projects efficiently. Contractor Foreman offers a 30-day free trial and flat annual pricing options for a limited number of users. Although Contractor Foreman offers four pricing plans, the lower tier plans include the core features most teams will need to manage their projects.
Pricing
Unlike other construction project management solutions, which charge on a per-user basis, Contractor Foreman offers a flat monthly rate for its packages:
Standard: $49 per month billed annually.
Plus: $87 per month billed annually, or $133 per month billed quarterly.
Pro: $123 per month billed annually, or $189 per month billed quarterly.
Unlimited: $148 per month billed annually, or $228 per month billed quarterly.
Figure E
The Contractor Foreman dashboard.
Features
Integrates with several third-party solutions, including Angi Leads, CompanyCam, Google Calendar, Gusto, Outlook 365 Calendar, QuickBooks Desktop, QuickBooks Online, SweetPay, WePay by Chase and Zapier.
Permits users to run an unlimited number of projects.
Includes daily logs of complete project records, weather tracking and material and equipment used.
Allows electronic approvals and signatures.
Supports Gantt charts.
Pros
30-day free trial is available.
100-day money back guarantee.
Easy-to-use and intuitive user interface.
Specifically designed with the needs of contractors in mind.
Cons
Standard plan lacks client portals.
Somewhat limited integrations.
Training on how the modules integrate together could be improved.
Procore: Best for technical support
Image: Procore
Procore is cloud-based construction project management software for general contractors, specialty contractors, subcontractors, owners and developers, and government agencies. Construction professionals can use the tool to manage projects from pre-construction through closeout, including document management, budgeting, scheduling, RFIs, submittals, quality and safety, field productivity management and collaboration.
Pricing
Procore doesn’t advertise rates on its website. Potential buyers should contact the Procore sales team for pricing information.
Figure L: Procore dashboard
Features
Integrates with over 400 applications, including DocuSign, Criterion HCM, 360 Sync, AkitaBox and Hiboo.
Provides real-time visibility into project financial health.
Includes intelligent specification management.
Allows for unlimited storage.
Pros
24/7 customer support.
Mobile app available for iOS and Android.
Active community forum with over 40,000 members.
Cons
Lack of transparent pricing.
Limited scalability.
High learning curve due to the extensive features.
Houzz Pro: Best for lead generation
Image: Houzz Pro
Houzz Pro is a business platform for industry professionals, including home remodelers, interior designers, architects, landscape professionals and other building professionals. It connects professionals with customers, provides marketing and networking tools, and offers insights into the home improvement industry. It also offers resources for business growth, including advertising, lead management and analytics.
Pricing
Houzz Pro offers four pricing plans:
Starter: $99 per month for one user; additional users cost $40 per user per month.
Essential: $139 per month for one user; additional users cost $40 per user per month.
Pro: $199 per month for one user; additional users cost $40 per user per month.
Ultimate: $399 per month for unlimited users.
Figure N: Houzz Pro dashboard
Features
Lead generation program.
Various marketing solutions for email marketing, custom website development and targeted advertising.
Messages to potential clients sometimes get caught in spam.
Key features of construction management software
Software for construction project management needs to combine general purpose project management features with construction-specific capabilities. Here are eight features that you should look out for when comparing software for construction management:
Time tracking and scheduling
The best construction project management software should let you schedule workers for shifts and track billable hours worked, all within the tool itself. Some may also offer integrations with popular time tracking and scheduling software in case you already have a solution in place.
Estimate and bid management
Your team will likely be submitting bids on multiple projects at once, as well as receiving estimates from subcontractors. These are sometimes called RFIs, a.k.a. requests for information. Construction project management software will allow you to track these bids and their associated costs to reduce the chance of miscalculations and ensure that you’re staying on top of deadlines.
Accounting and financial management
Once the project actually gets going, you will also need to track inventory costs, invoice the client and make sure the project is staying within budget. The best construction management software will let you do all that and more with sophisticated accounting and financial management tools. It should also integrate with popular accounting software, such as Quickbooks.
Field management
Keeping track of all your workers across various job sites is one of the most important features in construction-specific software. This involves booking service appointments, coordinating dispatch and setting estimated completion dates. If you are considering a more general purpose project management software, make sure that it will provide the field management capabilities that you need for your construction projects.
Mobile and tablet apps
On the topic of field management, most people aren’t logging into their laptops in the middle of a job site. That’s why you will want to seek out a software that offers well-developed mobile and tablet apps so your managers and employees can use them while on location.
Client and contractor access
At some point during the project, clients and/or contractors are going to need to access the software — but you might not want them to see every single nitty gritty detail. Being able to set permissions for different users is a helpful feature for construction project management software to have. Some platforms even offer a dedicated client portal, so they get their own login experience.
Communication tools
To keep everything streamlined in one tool, look for construction management software that integrates chat and communication tools directly within the interface. Ideally, it should also integrate with popular email clients like Outlook and Gmail so that your email communications will be centralized in the same place.
Document management
If your construction management software offers document management capabilities, you’ll never need to hunt down an updated contract or the latest certificates and licenses. All of these documents will be right in the tool’s database, easily accessible via search so you can find it in a snap.
How do I choose the best construction management software for my business?
When selecting a construction project management software solution, consider your needs, goals and budget. You want a tool that will meet your requirements and make the management process more efficient, all while staying within budget and providing visibility at all stages of the construction project life cycle.
Consider the following tips while evaluating prospective construction project management software options:
Determine your project scope
Determining your project scope means deciding how many people need to be involved, how many tasks need to be completed and how much of the work can be done in-house. Knowing these details will help you narrow down the type of construction project management software that best fits your needs.
Research various solutions and compare features
Look for tools that offer the features you need for a reasonable price. Pay attention to whether the software has comprehensive task tracking and management capabilities as well as project cost estimation and time tracking functions.
Consider user experience
How user-friendly is the software you’re evaluating? Does it have an intuitive design with a straightforward interface? Will team members require extensive training to be able to use the software? The easier it is to use, the more likely your team will be to adopt the tool and use it correctly to increase project productivity.
Look for relevant integrations
Ensure the software you choose integrates with other tools your business uses most often, such as accounting, payroll and scheduling systems. Finding these integration opportunities now will save you time and effort when transferring data between different applications.
Methodology
To determine the best construction project management software for 2023, we evaluated over 20 solutions from leading providers. We compared the features, capabilities and pricing of each product and then narrowed down our list to the top seven solutions. Our evaluation criteria for construction project management included the following:
Usability: We assessed how user-friendly each construction project management solution is. This included assessing how easy it is to set up and manage projects, assign tasks, view project reports and collaborate with team members.
Functionality: We reviewed the features offered by each solution, including project planning and scheduling, resource management, project tracking, collaboration tools and reporting capabilities.
Customer support: We evaluated each platform’s customer support system and how helpful they are in resolving issues. We also reviewed data from third-party review websites and business rating platforms such as the Better Business Bureau.
Costs: Our review considered solutions that are best for budget-conscious companies as well as solutions for companies that are ready to invest more money for more features. We looked at what kind of payment plans and pricing options were available for each solution.
Security: We looked at the security measures taken by each system, searching for each platform’s encryption, authentication and data storage capabilities.
Analytics: We examined what analytics and insights each construction project management solution provides for metrics like resource allocation, task duration and project milestones.
Customizability: Good construction project management software should be flexible enough for customization according to different business needs and processes. We examined each solution’s customizability options, such as the ability to create custom fields or integrate with third-party tools for smoother project workflows.
Reporting and collaboration: To ensure teams stay on track, effective reporting and collaboration features are necessary. The best construction project management software solutions listed here were evaluated based on their abilities to provide useful insights while allowing teams to work together efficiently across departments and locations.
Scalability and integration: We reviewed each solution’s ability to integrate seamlessly with other programs and platforms. In addition, we assessed each platform’s scalability — whether it can scale up or down based on changing company needs.
With these criteria in mind, we determined the seven best construction project management software solutions of 2023. Each tool has its own strengths and weaknesses, but all offer quality services for managing the ins and outs of construction projects.
Our GPU benchmarks hierarchy ranks all the current and previous generation graphics cards by performance, and Tom’s Hardware exhaustively benchmarks current and previous generation GPUs, including all of the best graphics cards. Whether it’s playing games, running artificial intelligence workloads like Stable Diffusion, or doing professional video editing, your graphics card typically plays the biggest role in determining performance — even the best CPUs for Gaming take a secondary role. Current GPU prices are slowly trending down as well, though the new cards are all holding relatively steady.
We’re nearly finished retesting all of the ray-tracing capable GPUs on a slightly revamped test suite, using a Core i9-13900K instead of a Core i9-12900K. For now, we have the same test suite we used in 2022. Our latest additions to the hierarchy are Nvidia’s RTX 4070 and RTX 4060 Ti, and AMD’s Radeon RX 7600. We’ve also retested a bunch of cards to clear up some lingering oddities from earlier testing.
Our full GPU hierarchy using traditional rendering (aka, rasterization) comes first, and below that we have our ray tracing GPU benchmarks hierarchy. Those of course require a ray tracing capable GPU so only AMD’s RX 7000/6000-series, Intel’s Arc, and Nvidia’s RTX cards are present. The results are all without enabling DLSS, FSR, or XeSS on the various cards, mind you.
Nvidia’s Ada Lovelace architecture powers its latest generation RTX 40-series, with new features like DLSS 3 Frame Generation. AMD’s RDNA 3 architecture powers the RX 7000-series, with only two desktop cards presently released. Meanwhile, Intel’s Arc Alchemist architecture brings a third player into the dedicated GPU party, even if it’s more of a competitor for the previous generation midrange offerings.
On page two, you’ll find our 2020–2021 benchmark suite, which has all of the previous generation GPUs running our older test suite running on a Core i9-9900K testbed. It’s no longer being actively updated. We also have the legacy GPU hierarchy (without benchmarks, sorted by theoretical performance) for reference purposes.
The following tables sort everything solely by our performance-based GPU gaming benchmarks, at 1080p “ultra” for the main suite and at 1080p “medium” for the DXR suite. Factors including price, graphics card power consumption, overall efficiency, and features aren’t factored into the rankings here. The current 2022/2023 results use an Alder Lake Core i9-12900K testbed. Now let’s hit the benchmarks and tables.
GPU Benchmarks Ranking 2023
Image 1 of 4
(Image credit: Tom’s Hardware)
(Image credit: Tom’s Hardware)
(Image credit: Tom’s Hardware)
(Image credit: Tom’s Hardware)
For our latest benchmarks, we’ve tested (nearly) all GPUs released in the past seven years (plus a few extras) at 1080p medium and 1080p ultra, and sort the table by the 1080p ultra results. Where it makes sense, we also test at 1440p ultra and 4K ultra. All of the scores are scaled relative to the top-ranking 1080p ultra card, which in our new suite is the RTX 4090 (especially at 4K and 1440p).
You can also see the above summary chart showing the relative performance of the cards we’ve tested across the past several generations of hardware at 1080p ultra — swipe through the above gallery if you want to see the 1080p medium, 1440p and 4K ultra images. There are a few missing options (e.g., the GT 1030, RX 550, and several Titan cards), but otherwise it’s basically complete. We do have data in the table below for some of the other (older) GPUs.
The eight games we’re using for our standard GPU benchmarks hierarchy are Borderlands 3 (DX12), Far Cry 6 (DX12), Flight Simulator (DX11 AMD/DX12 Intel/Nvidia), Forza Horizon 5 (DX12), Horizon Zero Dawn (DX12), Red Dead Redemption 2 (Vulkan), Total War Warhammer 3 (DX11), and Watch Dogs Legion (DX12). The fps score is the geometric mean (equal weighting) of the eight games. Note that the specifications column links directly to our original review for the various GPUs.
GPU Rasterization Hierarchy, Key Takeaways
Nvidia RTX 4090 ranks first but costs 60% more than 2nd place AMD RX 7900 XTX.
RTX 4090 can encounter CPU bottlenecks at 1440p and 1080p.
New cards typically match previous gen GPUs that are one or two model tiers “higher” (e.g. RTX 4070 Ti vs. RTX 3090 Ti, or RX 6600 XT vs. RX 5700 XT).
RTX 4060 Ti ranks as the most efficient GPU, followed by the RTX 4070, RX 6600, RTX 4070 Ti, RX 6800, and RTX 4080.
The best GPU value in FPS per dollar is Intel’s Arc A750, as it now costs just $199. It’s followed by RX 6600, RX 6600 XT, RX 6750 XT, RX 6650 XT, and RX 6700 XT. The best value RTX card from Nvidia is the RTX 4060 Ti at number 10.
*: GPU couldn’t run all tests, so the overall score is slightly skewed at 1080p ultra.
While the RTX 4090 does technically take first place at 1080p ultra, it’s the 1440p and especially 4K numbers that impress. It’s only 3% faster than the next closest RX 7900 XTX at 1080p ultra, but that increases to 8% at 1440p and then 23% at 4K. Against the RTX 3090 Ti, it’s also a major upgrade: 14% faster at 1080p, 27% faster at 1440p, and 51% faster at 4K.
(Note that the above fps numbers incorporate both the average and minimum fps into a single score — with the average given more weight than the 1% low fps.)
Again, keep in mind that we’re not including any ray tracing or DLSS results in the above table, as we intend to use the same test suite with the same settings on all current and previous generation graphics cards. Since only RTX cards support DLSS (and RTX 40-series if you want DLSS 3), that would drastically limit which cards we could directly compare. You can see DLSS 2/3 and FSR 2 upscaling results in our RTX 4070 review if you want to check out the various upscaling modes might help.
Of course the RTX 4090 comes at a steep price, though it’s not that much worse than the previous generation RTX 3090. In fact, we’d say it’s a lot better, as the 3090 was only a minor improvement in performance compared to the 3080 at the time of launch, but with more than double the VRAM. Nvidia pulled out all the stops with the 4090, increasing the core counts, clock speeds, and power limits to push it beyond all contenders.
Stepping down from the RTX 4090, the RTX 4080 and RX 7900 XTX trade blows at higher resolutions, while CPU bottlenecks come into play at 1080p. We’ll be switching to an i9-13900K in the near future, and you can see early results in our latest GeForce RTX 4070, GeForce RTX 4070 Ti, and Radeon RX 7900 XTX and 7900 XT reviews.
Speaking of the RTX 4070 Ti, it ended up falling below the RX 7900 XT by 8–10 percent on average in our rasterization benchmarks. It will turn the tables in ray tracing, but if you don’t care about RT, you can certainly make the argument that the 7900 XT represents a better value — again, discounting DLSS as well.
(Image credit: Intel)
Outside of the latest releases from AMD and Nvidia, the RX 6000- and RTX 30-series chips still perform reasonably well and in some cases represent a better ‘deal’ — even though the hardware can be over two years old now. Intel’s Arc GPUs also fall into this category and are something of a wild card.
We’ve been testing and retesting GPUs periodically, and the Arc chips had some erratic behavior that we eventually sorted out (it was caused by Windows VBS getting turned on). Compared to our launch reviews, performance hasn’t changed much, outside of DirectX 9 games. There are a few other fluctuations, mostly from game updates rather than drivers, but Bright Memory Infinite Benchmark finally got fixed with the latest Intel drivers. Overall, the A770 8GB ends up landing just a bit ahead of the A750, at a slightly higher street price. Also note that the 8GB A770 comes with a factory overclock, which is why it sometimes outperforms the 16GB model.
Turning to the previous generation GPUs, the RTX 20-series and GTX 16-series chips end up scattered throughout the results, along with the RX 5000-series. The general rule of thumb is that you get one or two “model upgrades” with the newer architectures, so for example the RTX 2080 Super comes in just below the RTX 3060 Ti, while the RX 5700 XT lands a few percent behind the RX 6600 XT.
Go back far enough and you can see how modern games at ultra settings severely punish cards that don’t have more than 4GB VRAM. We’ve been saying for a few years now that 4GB was just scraping by, and these days we’d avoid buying anything with less than 8GB of VRAM — 12GB or more is desirable for a mainstream or high-end GPU. The GTX 1060 3GB, GTX 1050, and GTX 780 actually failed to run some of our tests, which skews their results a bit, even though they do better at 1080p medium.
Now let’s switch over to the ray tracing hierarchy.
(Image credit: Techland)
Ray Tracing GPU Benchmarks Ranking 2023
Enabling ray tracing, particularly with demanding games like those we’re using in our DXR test suite, can cause framerates to drop off a cliff. We’re testing with “medium” and “ultra” ray tracing settings. Medium means using medium graphics settings but turning on ray tracing effects (set to “medium” if that’s an option; otherwise, “on”), while ultra turns on all of the RT options at more or less maximum quality.
Because ray tracing is so much more demanding, we’re sorting these results by the 1080p medium scores. That’s also because the RX 6500 XT and RX 6400 along with the Arc A380 basically can’t handle ray tracing even at these settings, and testing at anything more than 1080p medium would be fruitless. We’ve finished testing all the current ray tracing capable GPUs, though there will undoubtedly be more cards in the future.
The five ray tracing games we’re using are Bright Memory Infinite, Control Ultimate Edition, Cyberpunk 2077, Metro Exodus Enhanced, and Minecraft — all of these use the DirectX 12 / DX12 Ultimate API. (Note that we have had to drop Fortnite from our latest reviews, as the new version broke our benchmarks and changed the available settings. Thanks, Epic!) The fps score is the geometric mean (equal weighting) of the five games, and the percentage is scaled relative to the fastest GPU in the list, which again is the GeForce RTX 4090.
Image 1 of 4
(Image credit: Tom’s Hardware)
(Image credit: Tom’s Hardware)
(Image credit: Tom’s Hardware)
(Image credit: Tom’s Hardware)
GPU Ray Tracing Hierarchy, Key Takeaways
Nvidia absolutely dominates in ray tracing performance, with the RTX 4090 nearly doubling AMD’s best AMD RX 7900 XTX in sixth place. Intel’s Arc A770 lands at number 27.
DLSS 2 upscaling with quality mode is supported in most ray tracing games and can boost performance an additional 30~50 percent (depending on the game, resolution, and settings used). FSR 2 can provide a similar uplift but it’s only in about a third as many games right now. XeSS support is even less common.
You’ll need an RTX 4070 or RTX 3080 or faster GPU to handle 1080p with maxed out settings at 60 fps or more, which means Performance mode upscaling can make 4K viable.
RTX 4060 Ti again ranks as the most efficient GPU, followed by RTX 4070, RTX 3060 Ti, RTX 4070 Ti, RTX 3070, and RTX 3060.
The best overall ray tracing “value” in FPS per dollar currently goes to the Arc A750, followed by RTX 3060 Ti, RTX 4070, RTX 3060, and Arc A770 8GB. AMD’s best DXR value is the RX 6600 in ninth, though the RX 6700 10GB in tenth is a better choice considering the DXR performance of the 6600.
Swipe to scroll horizontally
Tom’s Hardware Ray Tracing GPU Benchmarks Hierarchy
If you felt the RTX 4090 performance was impressive at 4K in our standard test suite, just take a look at the results with ray tracing. Nvidia put even more ray tracing enhancements into the Ada Lovelace architecture, and those start to show up here. There are still further potential performance improvements for ray tracing with SER, OMM, and DMM — not to mention DLSS3, though that ends up being a bit of a mixed bag, since the generated frames don’t include new user input and add latency.
If you want a real kick in the pants, we ran many of the faster ray tracing GPUs through Cyberpunk 2077‘s new RT Overdrive mode, which implements full “path tracing” (full ray tracing, without any rasterization). That provides a glimpse of how future games could behave, and why upscaling and AI techniques like Frame Generation are here to stay.
Even at 1080p medium, a relatively tame setting for DXR (DirectX Raytracing), the RTX 4090 roars past all contenders and leads the previous generation RTX 3090 Ti by 41%. At 1080p ultra, the lead grows to 53%, and it’s nearly 64% at 1440p. Nvidia made claims before the RTX 4090 launch that it was “2x to 4x faster than the RTX 3090 Ti” — factoring in DLSS 3’s Frame Generation technology — but even without DLSS 3, the 4090 is 72% faster than the 3090 Ti at 4K.
AMD continues to relegate DXR and ray tracing to secondary status, focusing more on improving rasterization performance — and on reducing manufacturing costs through the use of chiplets on the new RDNA 3 GPUs. As such, the ray tracing performance from AMD isn’t particularly impressive. The new RX 7900 XTX basically matches Nvidia’s previous generation RTX 3080 TI, which puts it just a bit behind the RTX 3090 — and Nvidia’s 4070 Ti outpaces it by 7–9 percent on average across our test suite. The step down RX 7900 XT meanwhile lands around the level of the new RTX 4070.
Intel’s Arc A7-series parts again show some strange behavior, with performance either besting the RTX 3060 in some cases, or trailing the RTX 3050 in others. Minecraft performance has been at least partially fixed now, though further driver tuning should still be coming.
(Image credit: Tom’s Hardware)
You can also see what DLSS Quality mode did for performance in DXR games on the RTX 4090 in our review, but the short summary is that it boosted performance by 78% at 4K ultra. DLSS 3 meanwhile improved framerates another 30% to 100% in our preview testing, though we recommend exercising caution when looking at performance with Frame Generation enabled. It can boost frame rates in benchmarks, but when actually playing games it often doesn’t feel much faster than without the feature. Overall, with DLSS2, the 4090 in our ray tracing test suite is nearly four times as fast as AMD’s RX 7900 XTX. Ouch.
AMD’s FSR 2.0 would prove beneficial here, if AMD can get widespread adoption, but it still trails DLSS. Right now, only one of the games in our DXR suite (Cyberpunk 2077) has FSR2 support, while three more from our rasterization suite support FSR2. By comparison, all of the DXR games we’re testing support DLSS2, plus another five from our rasterization suite — and three of the games even support DLSS3.
Without FSR2, AMD’s fastest GPUs can only clear 60 fps at 1080p ultra, while remaining decently playable at 1440p with 40–50 fps on average. But native 4K DXR remains out of reach for just about every GPU, with only the 3090 Ti, 4080, and 4090 breaking the 30 fps mark on the composite score — and a couple of games still come up short on the 4080 and 3090 Ti.
The midrange GPUs like the RTX 3070 and RX 6700 XT basically manage 1080p ultra and not much more, while the bottom tier of DXR-capable GPUs barely manage 1080p medium — and the RX 6500 XT can’t even do that, with single digit framerates in most of our test suite, and one game that wouldn’t even work at our chosen “medium” settings. (Control requires at least 6GB VRAM to let you enabled ray tracing.)
Intel’s Arc A380 ends up just ahead of the RX 6500 XT in ray tracing performance, which is interesting considering it only has 8 RTUs going up against AMD’s 16 Ray Accelerators. Intel posted a deep dive into its ray tracing hardware, and Arc sounds reasonably impressive, except for the fact that the number of RTUs in the A380 severely limits performance. The top-end A770 still only has 32 RTUs, which proves sufficient for it to pull ahead (barely) of the RTX 3060 in DXR testing, but it can’t go much further than that. Arc A770 also ends up ahead of AMD’s RX 6800 in DXR performance, showing just how poor AMD’s RDNA 2 hardware is when it comes to ray tracing.
It’s also interesting to look at the generational performance of Nvidia’s RTX cards. The slowest 20-series GPU, the RTX 2060, still outperforms the new RTX 3050 by a bit, but the fastest RTX 2080 Ti comes in a bit behind the RTX 3070. Where the 2080 Ti basically doubled the performance of the 2060, the 3090 delivers about triple the performance of the 3050. Hopefully a future RTX 4050 will deliver similar gains as the 4090, at a far more affordable price point.
(Image credit: Tom’s Hardware)
Test System and How We Test for GPU Benchmarks
We’ve used two different PCs for our testing. The latest 2022/2023 configuration uses an Alder Lake CPU and platform (with Raptor Lake results coming soon), while our previous testbed uses Coffee Lake and Z390. Here are the details of the two PCs.
Tom’s Hardware 2022–2023 GPU Testbed
Intel Core i9-12900K MSI Pro Z690-A WiFi DDR4 Corsair 2x16GB DDR4-3600 CL16 Crucial P5 Plus 2TB Cooler Master MWE 1250 V2 Gold Cooler Master PL360 Flux Cooler Master HAF500 Windows 11 Pro 64-bit
Tom’s Hardware 2020–2021 GPU Testbed
Intel Core i9-9900K Corsair H150i Pro RGB MSI MEG Z390 Ace Corsair 2x16GB DDR4-3200 XPG SX8200 Pro 2TB Windows 10 Pro (21H1)
For each graphics card, we follow the same testing procedure. We run one pass of each benchmark to “warm up” the GPU after launching the game, then run at least two passes at each setting/resolution combination. If the two runs are basically identical (within 0.5% or less difference), we use the faster of the two runs. If there’s more than a small difference, we run the test at least twice more to determine what “normal” performance is supposed to be.
We also look at all the data and check for anomalies, so for example RTX 3070 Ti, RTX 3070, and RTX 3060 Ti all generally going to perform within a narrow range — 3070 Ti is about 5% faster than 3070, which is about 5% faster than 3060 Ti. If we see games where there are clear outliers (i.e. performance is more than 10% higher for the cards just mentioned), we’ll go back and retest whatever cards are showing the anomaly and figure out what the “correct” result would be.
Due to the length of time required for testing each GPU, updated drivers and game patches inevitably will come out that can impact performance. We periodically retest a few sample cards to verify our results are still valid, and if not, we go through and retest the affected game(s) and GPU(s). We may also add games to our test suite over the coming year, if one comes out that is popular and conducive to testing — see our what makes a good game benchmark for our selection criteria.
GPU Benchmarks: Individual Game Charts
The above tables provide a summary of performance, but for those that want to see the individual game charts, for both the standard and ray tracing test suites, we’ve got those as well. These charts were up-to-date as of December 13, 2022, with testing conducted using the latest Nvidia and AMD drivers in most cases, though some of the cards were tested with slightly older drivers. We’ve added more cards since then, with newer drivers, and retested the Intel Arc GPUs.
Note that we’re only including the current and previous generations of hardware in these charts, as otherwise things get too cramped — and you can argue that with 29 cards in the 1080p charts, we’re already well past that point. (Hint: Click the enlarge icon if you’re on PC.)
These charts are up to date as of June 7, 2023.
GPU Benchmarks Hierarchy — 1080p Medium
Image 1 of 9
(Image credit: Tom’s Hardware)
(Image credit: Tom’s Hardware)
(Image credit: Tom’s Hardware)
(Image credit: Tom’s Hardware)
(Image credit: Tom’s Hardware)
(Image credit: Tom’s Hardware)
(Image credit: Tom’s Hardware)
(Image credit: Tom’s Hardware)
(Image credit: Tom’s Hardware)
Image 1 of 6
(Image credit: Tom’s Hardware)
(Image credit: Tom’s Hardware)
(Image credit: Tom’s Hardware)
(Image credit: Tom’s Hardware)
(Image credit: Tom’s Hardware)
(Image credit: Tom’s Hardware)
GPU Benchmarks Hierarchy — 1080p Ultra
Image 1 of 9
(Image credit: Tom’s Hardware)
(Image credit: Tom’s Hardware)
(Image credit: Tom’s Hardware)
(Image credit: Tom’s Hardware)
(Image credit: Tom’s Hardware)
(Image credit: Tom’s Hardware)
(Image credit: Tom’s Hardware)
(Image credit: Tom’s Hardware)
(Image credit: Tom’s Hardware)
Image 1 of 6
(Image credit: Tom’s Hardware)
(Image credit: Tom’s Hardware)
(Image credit: Tom’s Hardware)
(Image credit: Tom’s Hardware)
(Image credit: Tom’s Hardware)
(Image credit: Tom’s Hardware)
GPU Benchmarks Hierarchy — 1440p Ultra
Image 1 of 9
(Image credit: Tom’s Hardware)
(Image credit: Tom’s Hardware)
(Image credit: Tom’s Hardware)
(Image credit: Tom’s Hardware)
(Image credit: Tom’s Hardware)
(Image credit: Tom’s Hardware)
(Image credit: Tom’s Hardware)
(Image credit: Tom’s Hardware)
(Image credit: Tom’s Hardware)
Image 1 of 6
(Image credit: Tom’s Hardware)
(Image credit: Tom’s Hardware)
(Image credit: Tom’s Hardware)
(Image credit: Tom’s Hardware)
(Image credit: Tom’s Hardware)
(Image credit: Tom’s Hardware)
GPU Benchmarks Hierarchy — 4K Ultra
Image 1 of 9
(Image credit: Tom’s Hardware)
(Image credit: Tom’s Hardware)
(Image credit: Tom’s Hardware)
(Image credit: Tom’s Hardware)
(Image credit: Tom’s Hardware)
(Image credit: Tom’s Hardware)
(Image credit: Tom’s Hardware)
(Image credit: Tom’s Hardware)
(Image credit: Tom’s Hardware)
Image 1 of 6
(Image credit: Tom’s Hardware)
(Image credit: Tom’s Hardware)
(Image credit: Tom’s Hardware)
(Image credit: Tom’s Hardware)
(Image credit: Tom’s Hardware)
(Image credit: Tom’s Hardware)
Power, Clocks, Temperatures, and Fan Speeds
While our GPU benchmarks hierarchy sorts things solely by performance, for those interested in power and other aspects of the GPUs, here are the appropriate charts.
Image 1 of 4
(Image credit: Tom’s Hardware)
(Image credit: Tom’s Hardware)
(Image credit: Tom’s Hardware)
(Image credit: Tom’s Hardware)
If you’re looking for the legacy GPU hierarchy, head over to page two! We moved it to a separate page to help improve load times in our CMS as well as for the main website. And if you’re looking to comment on the GPU benchmarks hierarchy, head over to our forums and join the discussion!
Choosing a Graphics Card
Which graphics card do you need? To help you decide, we created this GPU benchmarks hierarchy consisting of dozens of GPUs from the past four generations of hardware. Not surprisingly, the fastest cards use either Nvidia’s Ampere architecture or AMD’s Big Navi. AMD’s latest graphics cards perform well without ray tracing, but tend to fall behind once RT gets enabled — even more so if you enable DLSS, which you should. GPU prices are finally hitting reasonable levels, however, making it a better time to upgrade.
Of course it’s not just about playing games. Many applications use the GPU for other work, and we covered some professional GPU benchmarks in our RTX 3090 Ti review. But a good graphics card for gaming will typically do equally well in complex GPU computational workloads. Buy one of the top cards and you can run games at high resolutions and frame rates with the effects turned all the way up, and you’ll be able to do content creation work equally well. Drop down to the middle and lower portions of the list and you’ll need to start dialing down the settings to get acceptable performance in regular game play and GPU benchmarks.
It’s not just about high-end GPUs either, of course. We tested Intel’s Xe Graphics DG1, which basically competes with integrated graphics solutions. The results weren’t pretty, and we didn’t even try running any of those at settings beyond 1080p medium. Still, you can see where those GPUs land at the very bottom of the 2020-2021 GPU benchmarks list. Thankfully, Intel’s Arc Alchemist, aka DG2, appears to be cut from entirely different cloth… well, mostly.
If your main goal is gaming, you can’t forget about the CPU. Getting the best possible gaming GPU won’t help you much if your CPU is underpowered and/or out of date. So be sure to check out the Best CPUs for gaming page, as well as our CPU Benchmarks Hierarchy to make sure you have the right CPU for the level of gaming you’re looking to achieve.
Interested in diving into 3D printing as a hobby or using it to start a small business, but don’t want to invest thousands of dollars right off the bat? Purchasing a budget 3D printer is a good way to get started or, if you’re an experienced maker, to build out your farm.
The good news is that you won’t lack for choices. There are dozens of capable budget 3D printers that sell for less than $300 and even some that go for below $200. The bad news is that, with a huge variety of makes and models, it can be difficult to find the right one.
At Tom’s Hardware, we test dozens of consumer / prosumer-level 3D printers each year, measuring their speed, output quality, features and ease-of-use. To help you choose, we’ve listed the best budget 3D printers on the market right now, along with the pros and cons of each.
Check out our Shopping Tips section below and go through a short checklist of things to keep in mind before making your purchases. If you have room in your budget for more premium options, check out our list of Best 3D Printers overall for more recommendations.
Best Budget 3D Printers
Best Budget FDM
Best Budget FDM 3D Printer
This is a solid FDM printer packed with great features that we really like such as automatic bed leveling, a direct drive extruder, and a heated double-sided PEI build platform. It performs as well as the original Kobra at an affordable price.
Read more below
Best Value FDM
Best Value FDM 3D Printer
The Kobra Go gets the job done for less. This workhorse machine comes as a do-it-yourself kit with a color LCD knob-controlled screen navigation; it’s easy is so easy to use and outputs smooth and clean quality prints.
Read more below
Best FDM for Beginners
Best Budget FDM 3D Printer for Beginners
The Creality Ender 2 Pro is affordable, portable and easy to use. This tiny machine is perfect for novice makers who want to try out 3D printing without a huge financial or workspace commitment. A good choice for classrooms or STEM labs.
Read more below
Best Budget Resin
Best Budget Resin 3D Printer
This resin printer produces excellent 4K+ prints. Its smaller size makes it easy to handle while taking up less space on your workbench. It has the widest build plate of any hobby level resin printer, giving you more room for printing beefy models.
Read more below
Best Value Resin
Best Value Resin 3D Printer
This rock-solid resin printer impressed us with its high-resolution quality outputs. The ease of use, solid construction, and high-quality components make the Elegoo Mars 2 Pro a fantastic value for anyone with a sub-$300 price range.
Read more below
Best Resin for Beginners
6. Anycubic Photon Mono 2
Best Resin 3D Printer for Beginners
The Photon Mono 2 is designed for anyone who wants to take on resin 3D printing for the first time. It comes with an extra-large screen protector for the LED glass. You also get quality 4K prints with a smaller-sized vat and a petite footprint that requires minimal space.
Read more below
Best Budget FDM 3D Printer
Fotis Mint’s Red Dragon Bust(Image credit: Tom’s Hardware)
Best Budget FDM 3D Printer
Specifications
Technology: FDM
Build Volume: 220 x 220 x 250 mm
Build Platform: Double sided PEI Spring Steel, Heated
Interface: 2.4 inch color LCD with knob
Bed Leveling: Inductive Auto Leveling
Connectivity: MicroSD/USB
Reasons to buy
+
Affordable price
+
Quality prints
+
Direct Drive
+
Auto bed leveling
Reasons to avoid
–
Z height adjustment is not beginner friendly
–
Difficult to upgrade
The Anycubic Kobra Neo is the best low-cost FDM 3D printer in the market today. It’s an ideal 3D printer for budget-conscious beginners or could be used as a reliable backup machine for long-time makers who needs more than one machine for their multiple projects. This printer is very similar to the company’s flagship Kobra in design and is also packed with great features that we really like such as automatic bed leveling, a direct drive extruder and a heated double sided PEI build platform.
The Neo is very easy-to-use as it is shipped 90 percent assembled so you can get your print projects started right away. It has a solid 220 x 220 x 250 mm build volume and a PEI flex plate that makes it easy to take your prints out without the need for scraping and damaging your plate in the process. In our testing, the Neo did an incredible job printing a very detailed dragon bust (Fotis Mint’s Red Dragon Bust) which came out with minimal stringing and showed off precise details of the model we chose.
Unlike the Kobra, this machine does not have touch screen for your setting configurations. But we felt that the knob controlled 2.4-inch color screen worked just fine to navigate the menus. Currently retailing at $169, the Neo comes at an affordable price range and has everything a new maker needs to start their 3D printing journey.
The Anycubic Kobra Go is very similar to the Neo in terms of its design. It has identical build volume, interface and even hardware. However, what distinguishes the Go from the Neo is that it is shipped as a do-it-yourself kit instead of a ready out-of-the-box package. The kit would require you to assemble the printer yourself. If you don’t mind spending an extra 40 minutes on setup and are up to the challenge to building your own printer, then the Kobra Go is just the machine for you.
Though seemingly light on premium features, the Go does include automatic bed leveling and PEI flexible build plate which are two of the most useful functionalities we look for in a 3D printer that makes it easy to use. In terms of output, the Kobra Go does well with detailed prints when you slow it down and use good filament. (Check out our Best Filaments for 3D Printing for suggestions.) In our test, we printed Clockspring’s Illusionist Vase at a .16 mm layer height with 65mm/s speed which resulted in a perfectly smooth print.
Additionally, the Anycubic Kobra Go supports more file formats and more filament types than the Neo so the Go gives you more options to play with. Retailing at $179, it offers so much value for your investment.
More: Anycubic Kobra Go Review
Best Budget FDM for Beginners
Model by Bugman140(Image credit: Tom’s Hardware)
Best Budget FDM for Beginners
Specifications
Technology: FDM
Build Volume: 165 x 165 x 180 mm
Build Platform: Textured Magnet on a heated bed
Interface: LED screen with Control Knob
Bed Leveling: Manual
Connectivity: Micro SD, Micro USB
Reasons to buy
+
Quality Prints
+
Easy to assemble
+
Small footprint
+
Silent stepper motors
Reasons to avoid
–
No assisted leveling
–
Tiny build volume
The Creality Ender 2 Pro is a solid choice as a starter machine for new makers. It is easy to assemble and operate, designed for portability and outputs great quality prints. The machine weighs under 10 pounds and has a top mounted handle for easy transport. It can easily fit small workspaces or stored away when not in use.
Compared to most printers, the Ender 2 Pro does have a smaller build volume of 165 x 165 x 180mm. Despite its size, the Ender 2 Pro is a reliable performer which includes an interruption recovery feature, so you won’t lose your work if something happens in the middle of your print.
In our tests, the Ender 2 Pro delivered detailed print quality. (Check out our Best Filaments for 3D Printing for suggestions.) Our prints of 3D Benchy and a crystal dragon came out looking fabulous with all the fine detailing we were looking for.
Assembling the Ender 2 Pro took no time at all. Out of the box, it is shipped 90% pre-assembled so you only need to screw in a few bolts and the machine is ready for use. And with its silent stepper drivers and quiet cooling fans, you can enjoy printing in peace for once. It also comes with a flexible textured bed that holds models tight while printing and molds peel right off once you are done.
Additionally, the Ender 2 Pro can be upgraded with 3rd party hotends and premium bed plates making this a machine that can advance with you as you hone your 3D printing skills yourself. It currently retails for $179 but is often on sale for much less.
More: Creality Ender 2 Pro Review
Best Budget Resin 3D Printer
(Image credit: Tom’s Hardware)
Best Budget Resin 3D Printer
Specifications
Technology: Resin
Build Volume: 163 x 102 x 180mm
LCD Resolution: 4098 x 2560
LCD Size: 7.6-inch
XY Axis Resolution: .04mm
Connectivity: USB
Reasons to buy
+
Detailed 4K+ prints
+
Fast 2 second per layer exposure time
+
Effortless print removal
+
Roomy build volume for a small printer
Reasons to avoid
–
4-bolt leveling platform
With its excellent 4K+ prints, easy set-up and large build volume, the Anycubic Photon M3 easily takes the crown as the best entry-level resin 3D printer we have reviewed.
What sets the Photon M3 apart from its competitors is its wide 163 x 102 x 180 mm build plate, which allows it to produce larger models in very fine detail. In our testing, we printed Louise Driggers’s Unicorn of Darkness and came out with impressive results. The 180mm tall model took over ten hours to finish, but the detailing on the unicorn’s horn and ornate mane was so clear and sharp.
The M3 includes an etched build plate that holds models very well during printing and lets you remove them easily when done. It also comes with handy safety features such as a pour spout for the metal vat and a screen protector for the LED glass to keep the machine safe from accidental dripping.
Originally sold at $300, it is now available for $70 less than MSRP. This makes it an even more attractive and affordable choice as budget high resolution resin 3D printer.
More: Anycubic Photon M3 Review
Best Value Resin 3D Printer
(Image credit: Tom’s Hardware)
Best Value Resin 3D Printer
Specifications
Technology: Resin
Build Volume: 129mm x 80mm x 160mm
LCD Resolution: 1620 x 2560
LCD Size: 6.08-inch
XY Axis Resolution: .05mm
Connectivity: USB
Reasons to buy
+
Spring-loaded self-leveling build platform
+
Integrated air filtration system
+
Solid metal construction
Reasons to avoid
–
Build volume can feel limited
–
Preloaded test print isn’t up to par
If you are looking for a quality high resolution resin 3D printer at a reasonable price-range, then you should include the Elegoo Mars 2 Pro in your short list. This machine comes with premium features such as integrated air filtration, 2K mono LCD resolution and solid metal construction, but without the premium price tag.
The Mars 2 Pro has a spring-loaded self leveling build platform that simplifies the set up configuration and makes it easy to calibrate. We also appreciate the built-in air filter which is a big plus for anyone sensitive to the smell of resin during the print process. (However, to minimize any danger of inhaling fumes, you still need to use the Mars 2 Pro in a well-ventilated room.)
In one of our tests, we used Printed Obsession’s Doom Guy model with the Elegoo Standard Photopolymer Clear Green resin and it printed perfectly on our first try. The print time took over eight and a half hours but was well worth it as the 2K resolution masking LCD picked up all the fine details of the 3D model.
For fast high-res resin 3D printing at an affordable price, the Elegoo Mar 2 Pro earns our best value recommendation.
More: Elegoo Mars 2 Pro 3D Printer Review
Best Budget Resin for Beginners
(Image credit: Tom’s Hardware)
Best Resin 3D Printer for Beginners
Specifications
Technology: Resin
Build Volume: 165 x 89 x 143 mm
LCD Resolution: 4096 x 2560
LCD Size: 6.6-inch Monochrome
XY Axis Resolution: 34 microns
Connectivity: USB Type A 2.0
Reasons to buy
+
Detailed 4K prints
+
Fast setup
+
Effortless print removal
+
Easy to navigate menus
+
Generous anti-scratch film to protect the glass
Reasons to avoid
–
Slippery feet on the base
–
Lightweight and cheap feel
The Anycubic Photon Mono 2 gets our nod as the best start-up printer for anyone who wants to get into resin 3D printing without breaking the bank. Designed specifically for first time resin users, this printer comes mostly assembled for easy setup, user friendly and includes an anti-scratch film screen protection.
It is light-weight and small for easy storage when not in use. But despite its compact size, the Photon Mono 2 features a bigger build volume than its Photon Mono cousins. We were able to fit six presupported minuatures on the build plate at once during our tests.
The Photon Mono 2 is a great printer for miniature models and small builds. It also comes with its own custom slicer, the Photon Workshop V3. Priced at $209, this machine is a solid and affordable option if you are looking to get started with resin 3D printing.
More: Anycubic Photon Mono 2 Review
Shopping for a Budget 3D Printer: Top Tips
Here are a few important points you should keep in mind when considering buying budget 3D printers.
✅ Cost? How much can you afford to spend? If your budget is really tight, you can grab a model that’s less than $200 but a sub-$300 budget will get you farther.
✅ FDM or Resin? The two main types of 3D printer are FDM, which involves spools of filament that are extruded onto the build plate or resin (aka SLA), which uses light to shape liquid resin. FDM printers are easier-to-use and don’t have the safety concerns that come with handling noxious chemicals. If you can handle them properly, Resin printers give you a bit more detail, particularly for miniatures. Given the ease of use, though, we think FDM are best for most people.
✅ Features: Look for auto bed leveling, easy setup and a good UI. On FDM printers, getting a PEI build plate or direct drive design are real pluses. For resin, look for a high output resolution (2K or 4K).
Although curved monitors are commonplace today, this wasn’t always the case. There used to be a time when non-CRT desktop monitors were all flat, which remains the case today with most laptop displays. However, as people spent more time in front of a monitor during the day, engineers looked for ways to help alleviate eye strain, which became more apparent as display sizes increased.
Curved monitors are designed to more closely match the field of view humans see with their eyes. With larger and wider displays, images further out towards the right or left edges tend to look distorted in your peripheral vision. However, a curved monitor that gently wraps around your periphery allows the image to more closely align with your field of view, which should, in theory, reduce eye strain.
Some common curvature ratings include 1,000R, 1800R, and 2500R. So, what do these numbers mean? The lower the number, the tighter the display curvature appears to the user. For example, 1800R refers to a radius of 1,800 millimeters. So, if you line up enough monitors from end-to-end, the circle they create would have a diameter of 3,600 mm.
Image 1 of 2
Curved Monitor Radius (Image credit: Viewsonic)
Visual Distortion, Flat vs Curved Monitors (Image credit: Viewsonic)
While most monitors come with a fixed curvature, some products on the market allow you to adjust this setting. For example, the Corsair Xeneon Flex 45WQHD240 allows the user to manually adjust the curvature from completely flat to a very tight 800R, which translates to a radius of 800 mm. At 800R, the 45-inch Flex provides an optimal viewing experience at just three to four feet.
Quick List
Best Overall
1. Samsung Odyssey Neo G8
Best Overall Curved Gaming Monitor
The Samsung Odyssey Neo G8 is the performance enthusiast’s monitor of choice thanks to its 4K resolution, tight 1000R curve, and fast 240Hz refresh rate. Measuring 32 inches across, the Odyssey Neo G8 also uses a Quantum Dot film to boost its contrast ratio far above traditional VA-backed monitors.
Read more below
Best Bendable
2. Corsair Xeneon Flex 45WQHD240
Best Bendable Curved Gaming Monitor
The Corsair Xeneon Flex seemingly offers it all. Not only does it have a huge screen at 45 inches, an OLED panel and a fast 240Hz refresh rate, but it can transition from a traditional flat panel to an 800R curve.
Read more below
Best Large-Format
3. Samsung 49-Inch Odyssey G9
BestLarge-Format CurvedGaming Monitor
The Samsung Odyssey G9 stretches out to an expansive 49 inches, and with the size comes a DQHD resolution of 5120 x 1440. The SVA panel means that its contrast ratio is excellent and you’ll find a fast 240Hz refresh rate. Best of all, the 1000R curve is tight for an immersive gaming experience.
Read more below
Best 34-inch
Best 34-inch Curved Gaming Monitor
34 inches is the sweet spot for gaming monitors when balancing price and the general ability to fin on most desks. In this segment, the Alienware AW3423DWF is hard to beat with its Quantum-Dot OLED panel, 1800R curve and 3440 x 1440 resolution. It’s also fast with a 165Hz refresh rate, and then there’s Alienware’s usual attention to detail and quality.
Read more below
Best Budget
Best Budget Curved Gaming Monitor
If you prefer your curved monitors on the smaller and more affordable side, look no further than the Dell S2422HG. Measuring just 23.6 inches across, the monitor has a Full HD (1920 x 1080) resolution, a 165Hz refresh rate and a 1500R VA panel with a 3,000:1 contrast ratio.
Read more below
Most Immersive
6. Philips Evnia 34M2C8600
Most Immersive Curved Gaming Monitor
The Philips Evnia 34M2C8600 takes the standard formula for 34-inch curved gaming monitors and combines a punchy, high-quality QD-OLED panel with Ambiglow technology. Ambiglow dynamically projects a “halo” of colors corresponding to the content being displayed on the screen to fully immerse gamers.
Read more below
Best Curved Gaming Monitors You Can Buy Today
Why you can trust Tom’s Hardware Our expert reviewers spend hours testing and comparing products and services so you can choose the best for you. Find out more about how we test.
Best Overall Curved Gaming Monitor
Best Overall Curved Gaming Monitor
Specifications
Screen Size & Aspect Ratio: 32 inches / 16:9
Resolution: 3840 x 2160
Panel Type: VA
Refresh Rate: 240 Hz
Response Time (GTG): 1ms
Adaptive-Sync : G-Sync Compatible, FreeSync
Reasons to buy
+
Stunning SDR and HDR images
+
Color accurate out of the box
+
Next-level gaming performance
+
Smooth motion processing and low input lag
Reasons to avoid
–
Color gamut volume is just average
It’s hard to be all things to all people, but the Samsung Odyssey Neo G8 tries its best. It uses a 32-inch VA panel that combines Mini LED lighting (1,196 dimming zones) and a Quantum Dot film to deliver greater contrast than what’s available on traditional VA monitors (25,000:1 in our testing compared to 3,000:1 typically found in VA panels).
Samsung also infused the Odyssey Neo G8 with a tight 1000R curve and a fast 240Hz refresh, which is a rarity at this 4K (3840 x 2160) resolution. Whether looking at SDR or HDR content, the Odyssey Neo G8 impresses with accurate color, and overall gaming performance is excellent.
While we would have liked a bit more color volume from the Odyssey Neo G8, it provides a lot of bang for the buck at its $1,499 MSRP. However, the monitor is often on sale, taking its price below $1,200.
Read:Samsung Odyssey Neo G8 Review
Best Bendable Curved Gaming Monitor
(Image credit: Tom’s Hardware)
Best Bendable Curved Gaming Monitor
Specifications
Screen Size & Aspect Ratio: 45 inches / 21:9
Resolution: 3440 x 1440
Panel Type: OLED
Refresh Rate: 240 Hz
Response Time (GTG): 0.3ms
Adaptive-Sync: FreeSync & G-Sync Compatible
Reasons to buy
+
Stunning picture with deep contrast and saturated color
+
Huge screen completely envelopes the user
+
Premium game performance with fast response and low lag
Reasons to avoid
–
HDR color a little off-hue
–
Low pixel density
–
Expensive
Corsair’s 45-inch Xeneon Flex is a premium monitor at a premium price. But its price tag is justified by its unique, bendable OLED panel that allows you to choose between a flat panel or an 800R (maximum) curve. You manually bend the screen using two handles extending from the chassis sides.
The Xeneon Flex exhibits good contrast and color accuracy. You also get a fast, 240 Hz refresh rate and low input lag. Adaptive Sync is standard, with support for AMD FreeSync Premium and Nvidia G-Sync. The wide-screen format with a 3440 x 1440 resolution should appeal to gamers and productivity workers alike.
There’s no such thing as a perfect product, and the Xeneon Flex suffers a couple of dings due to its relatively low pixel density courtesy of the 45-inch panel and slight misses with HDR color. However, the $1,999 MSRP will likely be the biggest hurdle for many gamers (although we’ve seen its street price dip below $1,700 recently).
The Samsung 49-Inch Odyssey G9 is one of the most extreme monitors on this page (or any page). Not only is it a massive 49 inches diagonally, but it also carries a 1000R curve. From a 2 to 3-foot distance, this panel fills your view. It’s like having two 27-inch, 1440p monitors in one. You’ll need nearly four feet of desk width and 17 inches of depth to accommodate it, but if you do, you’ll enjoy a wraparound gaming environment without image distortion.
Testing of the 49-Inch Odyssey G9 revealed excellent contrast (2,152.9:1 after calibration), which climbed to 58,881.7:1 when it came to HDR testing. This is a bright monitor with a sharp picture and accurate DCI-P3 and sRGB color.
Read: Samsung 49-Inch Odyssey G9 Review
Best 34-inch Curved Gaming Monitor
(Image credit: Tom’s Hardware)
Best 34-inch Curved Gaming Monitor
Specifications
Screen Size & Aspect Ratio: 34 inches / 21:9
Resolution: 3440 x 1440
Panel Type: QD-OLED
Refresh Rate: 165 Hz
Response Time (GTG): 0.5ms
Adaptive-Sync: FreeSync & G-Sync Compatible
Reasons to buy
+
Stunning SDR and HDR images
+
Deep contrast and color saturation
+
Large color gamut
+
Super smooth motion processing
+
No need for calibration
+
Premium styling and build quality
Desktop-class OLEDs used to be a rarity in the gaming monitor segment. But over the years, prices have come down, and more entries have entered the fray, including Alienware’s jaw-dropping AW3423DFW.
This is a 34-inch ultra-wide monitor with a 1800R curve and a resolution of 3440 x 1440. However, the most important spec is its use of a Quantum Dot OLED (QD-OLED) panel, which offers an extremely wide color gamut and the blackest blacks you’ll find in a gaming monitor.
The QD-OLED panel of the AW3423DFW gives it unmatched contrast and excellent color saturation with no need for calibration out of the box. Throw in premium build quality – as we expect from Alienware – plus top-notch video processing and the AW3423DFW hits all the high notes without any demerits worth mentioning for enthusiast gamers.
If you can get past the $1,100 price of entry, the AW3423DFW would make a perfect companion for Nvidia’s newest high-end graphics cards, like the GeForce RTX 4090.
Read: Alienware AW3423DW Gaming Monitor Review
Best Budget Curved Gaming Monitor
(Image credit: Tom’s Hardware)
Best Budget Curved Gaming Monitor
Specifications
Screen Size & Aspect Ratio: 23.6 inches / 16:9
Resolution: 1080p
Panel Type: IPS
Refresh Rate: 165 Hz
Response Time (GTG): 4ms
Adaptive-Sync : FreeSync & G-Sync Compatible
Reasons to buy
+
Saturated and accurate color
+
Excellent contrast
+
Low input lag
+
Superb value
Reasons to avoid
–
Weak overdrive
–
No sRGB mode
–
No speakers or USB
The Dell S2422HG might be small in stature at just 23.6 inches across, but it packs quite a punch at a very attractive, sub-$200 price.
The S2422HG has a 1920 x 1080 resolution and a relatively fast refresh rate at 165 MHz. Dell uses a 1500R VA panel, so you get excellent contrast at 3,000:1 (we measured better at 3,261.8:1) and a factory-rated brightness of 350 nits (although we only measured 324 nits). AMD FreeSync and Nvidia G-Sync compatibility is also included with this budget-oriented monitor.
Video processing for the S2422HG was good in our testing, and the low input lag was appreciated. However, we did have to knock the monitor for a few things it lacks, like an sRGB mode, integrated speakers, or any kind of USB hub functionality.
But with an MSRP of $199, the Dell S2422HG represents an excellent value in the curved gaming monitor space. In addition, we’ve seen the S2422HG fall to as low as $170 in recent months, which makes it an easy-to-recommend curved gaming monitor for those on a budget.
Read: Dell S2422HG Review
Most Immersive Curved Gaming Monitor
(Image credit: Tom’s Hardware)
Most Immersive Curved Gaming Monitor
Specifications
Screen Size & Aspect Ratio: 34 inches / 21:9
Resolution: 3440×1440
Panel Type: Quantum Dot
Refresh Rate: 175 Hz
Response Time (GTG): 0.1ms
Adaptive-Sync : FreeSync & G-Sync Compatible
Reasons to buy
+
Stunning image in every respect
+
Wide color gamut with infinite contrast
+
Razor sharp picture
+
Accurate color without calibration
+
Superb video processing
+
Ambiglow is a truly useful lighting feature
Reasons to avoid
–
No RGB color temp adjustments
The Philips Evnia 34M2C8600 aims to impress, starting with its gorgeous QD-OLED panel. This is a significant upgrade from the VA panel found on its “lesser” 34M2C7600 sibling. The basics don’t stray too far from many 34-inch widescreen monitors we’ve tested, with its 1800R curvature, WQHD (3440 x 1440) resolution and 175Hz refresh rate. Still, the QD-OLED panel delivers accurate colors (without the need for calibration out of the box), a wide color gamut and excellent overall image quality.
However, the ace up the 34M2C8600’s sleeve is the inclusion of Philips’ Ambiglow technology. Ambiglow provides bias lighting to project light on the wall behind the monitor. As we found in our testing, Ambiglow helps to increase the perception of improved contrast and sharpness of the image.
With a price tag of $1,299, the 34M2C8600 definitely isn’t aimed at the budget crowd, but its image quality, features, and uniqueness of Ambiglow make it an attractive option for gaming enthusiasts.
Read:Philips Evnia 34M2C8600 Review
Benefits of Using a Curved Monitor
As we mentioned before, a gentle curve can help reduce eye strain with a larger screen. While this is, of course, beneficial to gamers who spend hours hunting down opponents in online frag fests, it’s equally appealing to office workers who spend their 9-to-5 staring at a screen, working on everything from documents to spreadsheets to photo editing.
Beyond that, thoguh, curved displays also provide a more immersive experience by wrapping the picture around your field of vision. Just imagine a racing simulator, like F1 2023, with three curved monitors arranged around you. The monitor to your immediate front would give you a clear view of the road ahead. Monitors to the right and left would provide for glanceable views of your periphery, allowing you to see vehicles trying to overtake you or the ability to see around an upcoming corner. And since the monitors are curved, there’s a gentle transition from panel to panel that cannot be achieved with flat panels.
Quick Shopping Tips
Here’s what you should consider when looking for the best curved gaming monitor.
✅ What size do you need? The smaller the display, the less need for a curved panel. You don’t typically start seeing curved monitors until you get to 24 inches and higher. From there, the options are practically limitless, with 32- and 34-inch curved monitors being among the most popular on the market. For those that want to go big or go home, 49-inch behemoths with an 800R curve are ready and waiting.
✅ What curvature best suits your needs? 1900R, 1800R, 800R, oh my! The key thing to keep in mind is that the lower the number, the more exaggerated the curve. Larger widescreen monitors (think 45 inches and greater) tend to adopt 1000R to 800R curves. As you step down to smaller monitors, the curves tend to see 1500R and 1800R more frequently – this isn’t an exact science but more of a general trend. For example, the 34-inch Alienware AW3423DW features a 1800R curve, while the 24-inch Dell S2722DGM features a more aggressive 1500R curve.
✅ VA, IPS or OLED? VA displays are most prevalent in the curved monitor space, and typically have great response times. IPS panels offer better color, but slower response times (and generally less contrast). OLED displays offer the best of both worlds along with infinite contrast, but they are the most expensive, by far.
✅ What refresh rate should you choose? First off, bigger is better. This number explains the number of times your monitor updates with new information per second — stated in hertz (Hz) — and, therefore, how many frames per second (fps) the monitor can display. Bigger numbers mean smoother images. Refresh rate is especially important for competitive gamers, so you’ll want to shoot for a monitor with at least 120 Hz (most gaming monitors offer at least 144 Hz), combined with the lowest response time you can find.
Payroll software empowers business owners, HR departments and accounting teams to tackle employee pay in-house. The right software can streamline tedious tasks like tax filing, which in turn frees up time to spend on other aspects of business management.
Gusto is the best payroll software solution for many small businesses because of its thorough automation, comprehensive payroll tools and optional employee benefits with built-in administration. But if Gusto isn’t the best fit for you, we have seven other payroll solutions for you to consider. Below, we’ll weigh their features, strengths and weaknesses.
Jump to:
Top payroll software: Comparison table
Every payroll software on our list can be used to determine paycheck amounts, automate employee payments, generate payroll reports and calculate payroll taxes. All of our top payroll services also include unlimited payroll runs, meaning users can run payroll an unlimited number of times per month without incurring an extra fee.
The top payroll management systems differ in terms of starting price, app availability, third-party integrations (especially accounting software integration), time tracking and employee benefits administration.
Feature
Starting base price
Starting per-payee price
Free trial
General ledger integration
Learn more
Gusto
$40/mo.
$6/payee
No
Yes
ADP
Custom quote
Custom quote
Up to 3 mos.
Yes
Rippling
Custom quote
$8/payee
No
Yes
OnPay
$40/mo.
$6/payee
30 days
Yes
Papaya
N/A
$12/payee
Unlisted
Yes
Paychex
$39/mo.
$5/payee
No
Add’tl fee
SurePayroll
$19.99/mo.
$4/payee
Up to 6 mos.
Yes
QuickBooks Payroll
$45/mo.
$5/payee
30 days
Yes
Data accurate and verified as of 6/15/2023.
The year’s best payroll software
The best payroll software for most businesses isn’t necessarily the best payroll software for your business. As you weigh your options, consider what level of customer support you need, whether you need a scalable product and how many employees you hope to eventually add to your company.
Perhaps most importantly, make sure the payroll software you choose can support your business’s size. Several of the payroll software we review below is geared toward small and midsize businesses, though some (like ADP and Rippling) can support large enterprises as well. To learn more about payroll software specific to your business’s size, see the following reviews:
Gusto: Best small-business payroll software
Image: Gusto
Gusto’s modern payroll and HR platform offers payroll processing, employee benefits administration and talent management solutions. As one of the most popular small-business payroll providers, Gusto integrates with dozens of popular third-party applications, including accounting solutions like QuickBooks Online and Xero.
Along with third-party integrations, Gusto’s payroll service also has built-in time tracking and project tracking features for higher-priced plans. These capabilities enable users to quickly track team hours and process time off requests and approvals. Workers can track their time by logging their hours on a computer or through Gusto’s employee mobile time-tracking app, which uses geolocation to verify hours.
Features
Basic hiring and onboarding tools with all plans.
Gusto-brokered health insurance options in 37 states.
Additional employee benefit options include 401(k) retirement plans, commuter benefits, college savings accounts and free financial tools.
Pros
Thorough employee self-service features with employee profiles, e-signature capabilities and easy access to documentation.
HR features including performance reviews, employee surveys and access to certified HR experts (with pricier plans only).
Automated payroll runs and automatic general ledger updates.
Cons
Basic plan users don’t have access to customer support on weekends.
Limited HR tools with cheapest plan, especially compared to all-in-one payroll systems like ADP and Paychex.
High per-employee fee with pricier plans can make the solution too expensive for organizations with a greater number of employees.
Pricing
Gusto offers three pricing tiers:
Simple plan: Starts at $40 per month, plus $6 per month per employee.
Plus plan: Starts at $80 per month, plus $12 per month per employee.
Premium plan: Pricing for this plan is available upon request.
If you pay contractors only, Gusto’s contractor plan costs $6 per contractor paid per month for six months, then $35 per month plus the per-contractor fee after that. Gusto also has an international contractor payment plan that lets businesses pay independent contractors in 95+ countries.
Learn more about Gusto by reading our in-depth Gusto payroll software review.
ADP: Best for midsize to large organizations
Image: ADP
With ADP’s main payroll product for small and midsize businesses, RUN Powered by ADP, business owners can run payroll automatically and pay employees using multiple pay methods. Every plan comes with HR tools like new-hire reporting, onboarding assistance, background checks and built-in time and attendance.
ADP’s other payroll products include its PEO ADP TotalSource, ADP Workforce Now for midsize and larger businesses and ADP Global Payroll for multi-country companies and enterprises. If you’re interested in a cheaper product, Roll by ADP is an ADP-backed payroll app for the smallest of small businesses. It starts at $29 a month plus $5 per employee.
Features
Multi-jurisdiction payroll processing features.
Employee self-service portal access.
Employee discounts, which provide workers with discounts on brand-name products and with local retailers.
Exceptional reporting features, including thorough and customizable payroll and HR reports.
Pros
Payroll management services across 140 countries.
Integrations with an extensive range of popular third-party software systems.
Robust, customizable reporting capabilities.
Comprehensive optional add-on features include retirement plans, workers’ compensation insurance and employee health benefits.
Cons
No transparent pricing online.
Reporting features may have a higher learning curve for new users.
State Unemployment Insurance management features only available with higher-priced plans.
Pricing
ADP doesn’t list the base prices for any of its payroll solutions online, including RUN Powered by ADP. Interested parties must contact ADP directly for a quote.
Many of ADP’s plans and products can be completely customized, and you can also request a customized demo when deciding whether or not to purchase ADP.
Learn more about ADP in our thorough ADP Workforce Now review.
Rippling: Best for automation
Image: Rippling
Rippling’s full-service payroll solution has excellent built-in compliance support and HR tools, which makes it a solid alternative to software that focus more on payroll than they do on HR (for instance, Gusto). Its payroll plan includes workers’ compensation insurance administration, customizable reports and excellent compliance oversight. Most notably, Rippling lets businesses build custom automations, including custom policies for syncing payroll data with your general ledger.
Rippling’s other HR products include time and attendance software, benefits administration, applicant tracking and learning management. Companies can also add Rippling’s IT and finance software to its HR and payroll plan, creating a customizable package that grows with companies as they scale from startups to international enterprises.
Features
Employee health insurance benefits in all 50 states.
Pre-built workflow templates for easier workflow customization.
Built-in wage garnishment.
Integration with top accounting software including QuickBooks Online, Xero, Sage, Oracle NetSuite and more.
Pros
International payroll processing available.
Easy-to-customize plans include only the modules you want.
Thorough integration with every product in the Rippling suite.
Comprehensive, customized automations for most business processes.
Cons
Likely more expensive than many competitors, especially price-conscious payroll options like SurePayroll.
Expensive plans are outside many small and midsize businesses’ budgets.
Workflow automations can have a high learning curve for first-time users.
Pricing
Rippling charges $8 per employee per month on top of a standard monthly base fee. However, Rippling doesn’t list its base price online (though the site previously listed its starting price at $35 per month). Plus, each additional module costs an extra per-employee or per-month charge, which can cause package prices to add up quickly.
Dig deeper into Rippling’s features by reading our Rippling payroll review.
OnPay: Best for specialized payroll services
Image: OnPay
OnPay’s payroll software program helps businesses in all industries pay employees, offer benefits, deposit taxes and get solid HR assistance. Along with its general payroll services, OnPay also offers industry-specific payroll services tailor-made for more niche companies. For instance, OnPay’s bar and restaurant payroll solution includes features for processing tipped wages, employee onboarding and time-tracking software integrations.
All of OnPay’s payroll plans include an impressive amount of HR features (especially when compared to similar HR payroll solutions like Gusto). Features like compliance auditing and HR library access give small and midsize businesses access to HR tools they’d typically have to pay extra for. OnPay’s stellar payroll features include wage garnishment and free multi-state payroll — two services most of the other top payroll systems charge extra for.
Features
Thorough, fee-free integration with third-party software like QuickBooks Online, QuickBooks Time, Xero and more.
Ongoing COVID-19 compliance features, including a COVID-19 dashboard for managing tax credits and forgiveness.
Free white-glove setup and data migration.
Optional OnPay-brokered insurance benefits in all 50 states.
Pros
Payroll features specific to businesses in specific sectors like restaurants, farms and agriculture, nonprofits, churches and clergy, and 500+ employee companies.
Far fewer add-on fees than other payroll providers, especially pricy competitors like Paychex.
Custom PTO policy creation with automatic PTO accrual, calendars, time-off requests and manager approvals.
Cons
Phone, chat and email support limited to weekdays with only emergency email support available on weekends.
One plan only, which may be less scalable for rapidly growing businesses (compared to multi-plan competitors like Gusto and Paychex).
No international payroll options, including international contractor payments.
Pricing
OnPay payroll has just one plan that includes all of its payroll and HR features. It costs $40 per month as a base fee plus $6 per month per employee.
Learn more about OnPay’s payroll system by reading our comprehensive OnPay review.
Papaya Global: Best for international payroll
Image: Papaya
Papaya Global is one of the best payroll software programs for international businesses. Its global payroll services let employers pay workers in 12 local currency systems in more than 160 countries. Papaya can deposit paychecks directly into employees’ bank accounts, and it can also make third-party payments on your behalf to entities like the IRS or legally mandated pension accounts around the world.
Businesses that currently use a payroll provider other than Papaya and don’t want to switch can still take advantage of Papaya’s international payroll services by paying for its payroll platform license, which costs $3 a month per employee. Plus, Papaya has a global benefits package that helps businesses offer global health insurance and provide localized benefits.
Features
AI-based compliance audits.
Global finance, HR and payroll features rolled into one package.
Local experts with knowledge on immigration, global compliance, equity, benefits and more.
Third-party integrations with Oracle NetSuite, Workday and more.
Pros
One of the most fully featured global payroll providers for U.S.-based companies.
Access to payroll and benefits in more than 160 countries.
Extensive international payroll library and compliance oversight.
Cons
Starting price might be outside many businesses’ budgets.
Fewer third-party integrations than some international payroll competitors.
Comparatively slow software setup and implementation.
Pricing
In contrast to most global payroll system providers, Papaya Global lists its starting prices upfront:
Full-service global payroll: Starts at $12 per month per employee.
Payroll platform licensing: Starts at $3 per month per employee.
Employer of record services: Start at $770 per month per employee.
International contractor management: Starts at $25 per month per employee.
Learn more about whether Papaya Global will work for you by reading our in-depth Papaya review.
Paychex: Best for HR solutions
Image: Paychex
Paychex’s all-in-one payroll software solution includes HR and payroll tools with optional add-on employee benefits. Unlike single-plan solutions (such as Square Payroll or OnPay), Paychex has four payroll plans that are designed for startups, enterprises and everything in between.
While Paychex has more or less the same full-service payroll features as Gusto, it has a more robust set of HR features. In contrast to Paychex’s professional employer organization service, its payroll and HR software isn’t a total HR solution. However, each Paychex plan has far more HR tools and support than any of Gusto’s plans, including access to a comprehensive HR library, optional financial wellness benefits for employees and access to labor posters.
Features
Multiple employee pay options, including direct deposit, paper checks and pay cards.
Employee benefits options, including a financial wellness program, employee assistance programs and insurance benefits.
Thorough human resource features with higher-tier plans, including an employee handbook builder and learning management system.
Pros
Access to an impressive range of optional employee benefits offerings.
Dedicated point of contact with 24/7 access to the customer support center.
Impressive HR library resources available with every plan.
Cons
Paychex is a pricier option compared to payroll services provided by other vendors, and pricing information for its higher-tier options is not available online.
Additional fees to process year-end W-2s and 1099s.
Additional fees for general ledger and accounting software integration.
Pricing
Paychex offers three different pricing tiers for its HR solutions:
Paychex Flex Essentials: Costs $39 per month, plus $5 per employee.
Paychex Flex Select: Custom quote.
Paychex Flex Pro: Custom quote.
Learn more about Paychex by reading our in-depth Paychex software review.
SurePayroll: Most affordable payroll
Image: SurePayroll
SurePayroll is both the cheapest payroll provider on our list of best payroll software as well as one of the cheapest payroll providers overall. Its lower price point doesn’t prevent SurePayroll from offering extensive payroll features — in some cases, more features than its paid payroll competitors. For instance, both SurePayroll plans include new-hire reporting, free two-day direct deposit and access to HR features like labor law compliance posters.
Businesses can also use SurePayroll to find 401(k) retirement plans for employees as well as health insurance and workers’ compensation insurance. SurePayroll also offers optional hiring tools like pre-employment screening and background checks.
Features
Optional health benefits backed by Paychex (SurePayroll’s parent company).
Budget-friendly full-service or cheaper self-service plan options.
Pros
Up to six months free for new customers.
Extended customer service hours with better-than-average response time.
Tax-calculation guarantee with self-service plan (plus industry-standard tax-filing guarantee with full-service plan).
Optional employee benefits add-on with employee benefits administration.
Cons
Two plans can limit scalability for growing businesses.
Fewer HR features than HR-focused competitors like Paychex and ADP.
Pricing
SurePayroll has two plans, both with transparent pricing:
Self-service payroll: Requires you to file payroll taxes on your own and costs $19.99 per month plus $4 per employee.
Full-service payroll: Includes automatic payroll tax filing performed by SurePayroll and costs $29.99 per month plus $5 per employee.
SurePayroll also has a handful of optional add-on costs. For example, multi-state tax filing costs an extra $9.99 per state.
Find out if SurePayroll is a good fit for you by reading our SurePayroll review.
QuickBooks Payroll: Best user experience
Image: QuickBooks
QuickBooks Payroll integrates naturally with QuickBooks Online, Intuit’s leading cloud-based accounting software used by thousands of companies globally. Since Intuit’s cloud-based products were built specifically for non-accountant business owners, those who already manage their finances through QuickBooks Online should enjoy a relatively low learning curve if they add QuickBooks Payroll.
Although QuickBooks Payroll has a relatively high starting base price, its per-employee fee is notably low. As a result, regardless of its higher base price, QuickBooks Payroll is cheaper for small and midsize businesses with five or more employees compared to similar payroll programs like Gusto, ADP and OnPay.
Features
Automatic payroll runs (available for businesses that pay salaried employees only).
Optional 401(k) plans and healthcare benefits.
Built-in time tracking through QuickBooks Time (additional fee).
HR support center (with more expensive plans only).
Pros
Transparent online pricing.
Multiple plan options for growing businesses.
24/7 live support (with pricier plans only).
Excellent integrations with Intuit QuickBooks suite of products and third-party software.
Cons
No free workers’ compensation integration and administration with cheapest plan.
Expensive add-ons, including time-tracking software.
Key features limited to priciest plans only, such as expert review and expert support.
Pricing
Unlike some of its top competitors, QuickBooks Online Payroll lists its prices clearly and upfront:
QuickBooks Payroll Core: Costs $45 per month plus $5 per employee.
QuickBooks Payroll Premium: Costs $75 per month plus $8 per employee.
QuickBooks Payroll Elite: Costs $125 per month plus $10 per employee.
New customers can choose between receiving 50% off QuickBooks’ base price for their first three months of service or signing up for a free trial of QuickBooks’ payroll software.
Learn more about QuickBooks Payroll by reading our QuickBooks Payroll review.
Key features of payroll software
Regardless of the software brand or type of payroll solution, all payroll software should calculate your employees’ paycheck amounts. Along with gross paycheck amounts, the software should also calculate deduction amounts for payroll taxes, healthcare premiums, retirement and other employee benefits, wage garnishments and optional deductions (like employee contributions to charitable funds).
From there, though, payroll software systems differ drastically in terms of their pricing and features. As you dive into the best payroll software companies listed above, consider which of the following features you need to effectively process payroll and how much you’re willing (and able) to pay for more expensive, comprehensive software.
Automatic payroll processing and tax remittance
Full-service payroll software, such as that offered by OnPay and QuickBooks Payroll, withholds payroll taxes on the employer’s behalf and remits those taxes to the IRS and other tax institutions on a regular basis. In contrast, self-service software will calculate tax amounts on your behalf but leaves the actual tax remittance up to you.
Self-service payroll software is cheaper than full-service software in terms of both per-payee pricing and monthly base costs. However, it saves businesses less time than full-service software, which often includes an autopilot feature for employers who want to run payroll without lifting a finger.
Payroll reporting
Most payroll software should include basic reporting features, starting with payroll reports that can be used to sync payroll expenses with your general ledger. Most should also include payroll tax withholding reports, employee paycheck reports, state unemployment tax reports and workers’ compensation insurance reporting.
More comprehensive software includes customizable reports with more in-depth analyses. For instance, payroll solutions like ADP and Paychex Flex include thorough human resource and benefits reports with impressive insights into payroll expenses and business growth.
Multiple pay methods
All payroll software should offer direct deposit as a primary employee pay option. However, the best payroll companies offer at least one other employee pay method, such as paper checks or app-based pay options like Gusto’s Wallet App or Square’s Cash App.
W-2 and 1099 form generation
At the end of each year, businesses must distribute tax form 1099 to contractors and W-2 to employees, plus file a copy of each tax form with the federal government. Nearly all payroll providers charge an additional fee to print and mail physical copies of each tax form, but most include electronic tax form access and distribution at no additional cost. (Paychex, which charges extra for W-2 and 1099 form preparation, is one notable exception.)
Compliance management
Payroll — especially payroll taxes — are heavily regulated by the federal government. Violations, accidental or not, can result in fines and more. As a result, the best payroll software includes thorough compliance management features that help you meet your legal obligations and avoid penalties for mistakes relating to tax law updates, wage garnishment orders and allocation rules.
Third-party integrations
Most payroll software integrates with third-party business apps like accounting software, HR products and time-tracking options. If you use cloud-based software to perform most business tasks, prioritize payroll software that automatically syncs with your favorite apps to keep all of them up to date on payroll expenses and employee data. Otherwise, you’ll spend more time entering data by hand.
How do I choose the best payroll software for my business?
1. Ask yourself key questions
To choose the right payroll software for your business, we recommend asking yourself several key questions that can guide your ultimate decision:
How much can you afford to spend on payroll software each month? Make sure to consider both the base fee and per-employee fee.
Do you primarily employ contractors, W-2 workers or a combination of both? Which types of employees do you anticipate having in the future?
Which payroll features do you consider essential to your business’s operations? For instance, if you have hourly employees, payroll that syncs with time-and-attendance software is a must.
How much support do you want (or need) as you set up your payroll software for the first time? Are you interested in white-glove setup with expert support, or do you feel confident setting up payroll software on your own?
How large is your organization now, and how large do you plan for it to become?
Which other software products do you currently use to keep your business up and running? How important is it to you to find software that syncs seamlessly with your existing apps and business processes?
Do you really want to run payroll in house, or are you interested in a completely hands-off solution like a professional employer organization or outsourced accounting company?
2. Try the software yourself
While in-depth comparative reviews like ours can help you make informed decisions about which payroll software is right for you, the best way to find your ideal payroll software is to test it for yourself. Many payroll software providers offer a free trial (or free account setup), and those that don’t will usually offer free, customized demos that walk you through every aspect of the software.
3. Talk to an expert
If you’re a new business owner processing payroll for the first time, we strongly recommend speaking with an accountant to better understand your payroll responsibilities, including and especially your payroll tax obligations. An accountant can also point you toward the best payroll software from an accounting point of view, which could also impact your final software decision.
Our methodology
To review the best payroll software for businesses, we set up free accounts with payroll providers whenever possible to test the software for ourselves. When creating a free account wasn’t an option, we viewed demos and watched product reviews from customers detailing their experience with the software.
In all cases, we read product spec sheets, thoroughly reviewed each company’s website and reviewed verified user reviews on trustworthy third-party sites.
After conducting this initial research, we used a proprietary in-house algorithm to calculate star ratings for each brand, determine their use cases and rank each brand according to its score.
Frequently asked questions
What is payroll software?
Payroll software is a (typically cloud-based) tool businesses use to pay their employees. Payroll software calculates paycheck amounts for both hourly and salaried employees, including gross paycheck amounts, payroll tax amounts and other paycheck deductions.
Most payroll software automatically deposits employees’ net pay via direct deposit and includes features like payroll reports, optional HR features (like employee benefits administration) and time-tracking solutions for hourly employees who clock in and out.
How does payroll software simplify payroll processing?
Payroll software removes the need for business owners to calculate paycheck amounts by hand. It also simplifies record-keeping processes and helps businesses stay legally compliant with tax and labor laws.
Is payroll software good for small businesses or only for larger enterprises?
Payroll software is good for any business owner who wants to save time on processing payroll and reduce the possibility of making a critical error with an employee’s paycheck amount or payroll taxes. Businesses in any industry and of any size can benefit from streamlining their payroll processes with payroll software.
How much does payroll software cost?
Most payroll products charge a monthly base fee along with a per-employee fee, though some payroll providers like Gusto and Square Payroll waive their base fees for business owners that pay only contractors. Most entry-level software plans charge around $20 a month as a self-service base fee and up to $45 a month as a full-service base fee. Per-employee fees for entry-level plans can range from $4 per employee to $10 per employee.
There are also free payroll software options, like Payroll4Free, which offers free payroll for businesses with up to 25 employees. Alternatively, businesses can use spreadsheet software like Excel (which costs a monthly fee) or Google Sheets (which is free) to calculate payroll by hand.
However, these more affordable payroll-processing methods aren’t feasible for businesses with dozens of employees. They’re also less ideal for businesses that want to save time on payroll while reducing the possibility of human error.
Which payroll software is best?
Gusto is generally considered the best payroll software for most small and midsize businesses. It syncs with dozens of third-party products, includes both HR and payroll features and offers thorough automation for businesses that want to minimize the time they spend on payroll each month.
At the same time, Gusto isn’t the best payroll product for all businesses. As you try to decide which payroll software is right for you, consider factors like pricing, scalability, features, customer support and third-party integrations.
If you want to laser all the things, but don’t want to shell out all the bucks, the xTool D1 Pro 20W is the laser for you. It’s packed with a powerful 20 watt diode laser, fire prevention safety features and includes free software to create and burn projects.
Part of xTool’s appeal is the support offered on its website, which is focused on the creative entrepreneur. Right on the menu bar is “Start Side Hustle” that leads to a page of ideas, tutorials and YouTube channels to inspire you. The company offers a shop full of raw materials and unbranded products, like cups, desk organizers and jewelry to personalize. Though you could source materials yourself, everything that xTool sells has a material profile in the laser’s custom software.
xTool provided the complete Productivity Kit for our review, which includes all the extras you need to launch an Etsy shop full of quality lasered products. We tested the enclosure, air assist, honeycomb work panel and rotary tool. Some of these “extras” aren’t so extra – I would advise anyone purchasing a laser to add the enclosure. It’s worth every penny for the safety it provides to the user as well as family members or pets who might wander into your workroom.
The xTool D1 Pro starts at $1399.99 for the 20 watt machine without extras. A lower power 10 watt laser is also available for $849.99. The company frequently offers sales and bundle discounts when you buy a laser with material and accessories.
Xtool offers the D1 Pro as a stand-alone unit and as various bundles. We received a Productivity Kit to view, which had everything you’d need to launch a successful engraving shop.
Shown above is the contents of the laser kit alone. This includes the laser tool head, tools to assemble the machine, safety glasses, a small metal plate to protect your work surface and a packet of materials to engrave. The sample materials kit includes sheets of wood, metal cards, dog tags and acrylic. Free software is available online to create artwork to burn and fully operate the machine.
We also received the enclosure with air assist, honeycomb work panel, rotary tool and various materials to engrave.
The honeycomb work panel is made to fit inside the frame and cover your work surface so you don’t have to worry about accidentally burning a hole in your desk. The honeycomb panel provides air flow that also prevents your materials from becoming charred.
(Image credit: Tom’s Hardware)
The D1 Pro consists of a boxy aluminum frame and X-axis gantry with no screen. We reviewed the “Golden Red” model, which was a nice change of pace from all the black metal hardware we’ve seen lately.
Cables and belts are tucked away inside the frame, giving the machine clean lines. Steel wheels make the machine more durable and precise. Optional legs can be purchased to lift the machine up for taller projects or to give clearance for long pieces of material to be passed underneath the laser.
The D1 Pro has a number of sensors: limit switches to prevent the laser from hitting the sides of the frame, a gyroscope to switch the machine off if it’s picked up, or falls, during operation and a flame detector to switch the laser off in case of fire.
The laser has a very finely focused beam, from .1 to .08 mm, for thin, detailed lines. The powerful 20 watt laser combined with a print speed of 400mm/s can cut and engrave faster to save you time when compared to a 5 or 10 watt laser like the Creality CR Falcon.
The D1 Pro does not have a screen of any sort and requires a computer to operate. You can connect to the laser with a USB cord, WiFi or phone app. I used WiFi and ran the laser from a desktop PC. There’s a start button on the machine to prevent unattended operation, so you’ll still need to stay in the area.
Focusing the laser is simple – a toggle loosens the toolhead so its height can be adjusted. A kickstand rotates down from the unit to touch the work surface. Tighten the toggle and flip the kickstand back up.
The laser can also project a harmless crosshair of light to help you align the tool on your project. This takes a lot of the guess work out of centering your projects.
(Image credit: Tom’s Hardware)
Safety is a major concern when operating laser devices. xTool has included a transparent shield attached to the laser module to prevent you from looking directly at the laser beam. You should still wear safety glasses (included) when operating the laser without a cover.
xTool offers assorted “bundles” when purchasing the D1 Pro laser. You can buy the machine on its own or add optional upgrades to make the most of your system. Items like the enclosure, air assist, and the honeycomb work surface seem almost necessary for the protection provided. Of course being able to purchase the system piecemeal is good for those who are upgrading a laser they already own.
The air assist blows cool air onto your work surface, which prevents charring while also keeping the smoke from gunking up the laser lens. The results are cleaner cuts, less charred looking engraving and a safer experience. The air pump and tubing are much like those seen on a fish tank or airbrush, and just as noisy.
The honeycomb work panel also provides extra safety and cleaner projects. The panel is a “honeycomb” iron grate over an aluminum panel. The grate holds your material off the surface, allowing both dust and heat to fall away. This keeps the back of your project much cleaner.
(Image credit: Tom’s Hardware)
The enclosure is a lightweight, fireproof box that folds flat when not in use. This makes it easy to pack away if you don’t keep your laser set up all the time. The bottomless box sticks together with Velcro, making it easy to assemble around the machine. A light filtering window in the top allows you to safely view your work. A vent on the side attaches to a hose with a small case fan to help push the air out. The hose can be directed out a window or an optional air purifier.
(Image credit: Tom’s Hardware)
(Image credit: Tom’s Hardware)
The D1 Pro arrives in kit form and is very easy to put together, with the X-axis module preassembled, the belts already threaded into channels on the Y-axis and most of the wiring done for you. It took me less than 40 minutes to set up.
The D1 Pro comes with a full color magazine style manual to help you get the machine together. There’s also a video on their website if you need extra help. The company’s support center also has lots of articles and videos to help you learn how to use your laser.
(Image credit: Tom’s Hardware)
The D1 Pro is a Class 4 laser that can damage your eyes and burn skin. It also produces smoke and fumes while engraving or cutting materials. You must take precautions to operate the machine safely. Use this and any other laser at your own risk.
The D1 Pro is equipped with a transparent safety shield over the laser module, however there is a slight gap between the shield and the material. Because of this gap, you must always wear safety glasses that protect you from the 455 nm (blue) wavelength light. A pair is provided with the machine.
The optional enclosure is well worth the extra cost, as it completely seals the laser from view. It also helps control smoke emitted from the materials that you’re burning. A small fan is included to help pull the air through a hose, which you can then hook up to a vent or other purification system.
Prevent pets and other people from observing the laser while in use.
Since the laser is literally burning material, never allow it to operate unattended and have a fire extinguisher handy just in case.
This is an open-frame device and only comes with a small sheet of metal to protect your work surface. XTool also makes a honeycomb work panel specifically for diode lasers that protect your table while also preventing your pieces from becoming charred.
Some materials should not be burned with a laser due to their chemical makeup – they could melt, catch fire or produce toxic fumes. Dallas Maker Space has published a list of safe and hazardous materials to use with their laser. The list of no-nos includes plastics, fiberglass and certain foams.
The laser lens can get dirty from smoke and fumes. You will need to wipe it clean – while unplugged – before each laser session. If it’s allowed to become dirty, the laser will lose some of its capability. You can use the lint free cloth xTool provides, or any soft cloth for cleaning eyeglasses.
(Image credit: Tom’s Hardware)
XTool provides free software – xTool Creative Space – you can download from their website to design projects and operate the laser. The program operates on Windows, Mac, MacOS and iOS.
This software is easy to operate and everything a beginner needs. It’s also tuned to work specifically for your laser – you must link the laser to the software – and has many helpful presets for materials sold by xTool. You can draw shapes, vector lines and add text with XCS. Best of all, the software understands JPGs so you can import photos and clipart without trouble.
The presets are specifically labels by thickness and material type which can give you a jumping off point for items you’ve sourced yourself.
The D1 Pro is also compatible with LightBurn, a premium laser program, for advanced users.
The ability to cut or engrave materials is determined by the speed and power settings of the laser. The D1 Pro is a high power, 20-watt laser, and cuts through most materials up to 10mm with ease. Thicker materials may require several slow passes at higher power. xTool’s software includes preset starting points for all the materials the machine can handle. You’ll still want to run a test, but I found the presets spot on, especially when using materials purchased from xTool’s shop.
The D1 Pro doesn’t have a camera to help line up your project, but it does have a harmless targeting crosshair. This allows you to place your item anywhere inside the workspace and line it up. Before lasering, the D1 Pro will run the tool head around the perimeter of the design so you can make sure your item is within bounds.
(Image credit: Tom’s Hardware)
Because the D1 Pro has a powerful 20-watt laser you can both engrave and cut many materials such as wood, acrylic, metal and stone. A complete list of materials and suggested settings is located at xTool’s website. These settings also correspond to materials the company sells on its website.
The first thing I tested was the light basswood provided by xTool. xTool Creative Space includes detailed project tutorials that walk you through several materials. The tutorials are very good and assume that you only have the basic laser set up and the included sample materials.
I made this phone holder twice, with and without the air assist on, to see how it affects the engraving. As you can see, the one on the left (no air assist) is more discolored by smoke. The design took about 18 minutes and a single pass to cut through the 3mm wood.
Sample project from xTool. (Image credit: Tom’s Hardware)
I created some ornaments for my parents, Bob and Sue, using Canva clip art. Canva is a free graphic design app available online. xTool Creative Space automatically suggested speeds and power levels to match the shading of the clip art. This piece took about 12 minutes to run, including burning the graphic and cutting out the 3 inch circular shape. I used sheets of 3mm basswood packaged for lasers, purchased from my local Microcenter. The cuts are super clean and only took one pass.
(Image credit: Tom’s Hardware)
I took the same design and etched it into a slate coaster provided by xTools. The stone takes longer to burn, so although I didn’t need to cut anything out, it still took about 22 minutes to etch at 25% power. The design isn’t as distinct as it is on wood, but it still looks pretty good.
(Image credit: Tom’s Hardware)
Last I put the design on a pair of steel cup using the xTool’s rotary attachment. The D1 Pro is strong enough to etch and color the metal. As you can see on the samples below, the laser easily removed the tumbler’s paint and shaded the metal underneath. These went fairly fast, about 20 minutes each to etch with a single pass at 40% power. The coffee cups were found at Walgreens, which proves you need to keep your eyes open for cool stuff to engrave at all times. I should note I totally destroyed a sample mug learning how to place the cup, so always buy extras to practice on.
(Image credit: Tom’s Hardware)
Bottom Line
(Image credit: Tom’s Hardware)
The xTool D1 Pro is a remarkable prosumer diode laser that starts out at $1399. It’s fast and powerful enough to support a small business or Etsy shop, yet easy enough for a beginner to use. This is definitely xTool’s target audience, as their website is packed with tutorials and blog posts on starting a business with its products.
The D1 Pro can cut through wood up to 10mm thick and engrave wood, card stock, leather, acrylic, metal and more.
It’s easy to assemble and includes safety features like flame detection and gyro, but I really recommend buyers also pick up the fireproof, light proof enclosure for a little more peace of mind. The basic machine only comes with a small piece of aluminum to protect your work surface, so upgrading to a honeycomb work panel is also recommended. This brings your price up to $1758, but sales and bundled discounts can reduce the cost.
If you’re not ready to invest in an xTool, the Two Trees TTS-55 is an open frame 5-watt laser with excellent engraving abilities, retailing for $299. The 10 watt Creality CR-Laser Falcon is another good laser to check out for $439.
Looking for an alternative to Xero? Here’s our comprehensive list covering the top competitors to help you find the best fit for your business.
Xero is an accounting software solution aimed at small and mid-sized businesses, as well as professional accountants and bookkeepers. Featuring double-entry accounting, it’s designed to maximize ledger accuracy, error prevention and fraud protection. The tool boasts over 3.5 million users, but that doesn’t mean it’s a perfect fit for every use case.
In this article, we’ll take a closer look at several alternatives to Xero so you can choose the best software for your business.
Jump to:
Top Xero competitors and alternatives: Comparison table
No business lasts long without an accurate financial record and an effective system for managing cashflow. But there is more to accounting than just managing a spreadsheet, and different industries have different financial concerns. We’ve highlighted four major areas of functionality and identified which solutions fulfill these areas.
Starting price for paid plans
Basic accounting functions
Time/project tracking functions
Logistics functions
HR functions
Xero
$13/mo.
Yes
Yes
No
Yes
QuickBooks
$30/mo.
Yes
Yes
Yes
Yes
FreshBooks
$17/mo.
Yes
Yes
No
Yes
Sage Intacct
Call for quote
Yes
Yes
Yes
Yes
Wave
$20/mo. + $6/employee
Yes
No
No
Yes
Zoho Books
$20/mo.
Yes
Yes
Yes
Yes
ZipBooks
$15/mo.
Yes
No
No
No
NetSuite
Call for quote
Yes
Yes
Yes
Yes
Kashoo
$216/yr.
Yes
No
No
No
Top Xero competitors
Bigger isn’t always better and less isn’t always more. Some businesses only need basic accounting support while others need comprehensive software suites to manage processes at scale. The list of competitors below reflects those varied use cases and are identified by their target market applications.
QuickBooks: Best for full-stack business resource management
Image: QuickBooks
The foremost name in business financial software, QuickBooks by Intuit is an industry powerhouse that has been around since the rise of digital systems. Designed to help organizations of any size track income and expenses, inventory, production costs and a great deal more, QuickBooks is among the most widely used solutions in the business landscape today.
Pricing
The core QuickBooks product has four pricing tiers:
Simple Start: Starts at $30 per month.
Essentials: Starts at $55 per month.
Plus: Starts at $85 per month.
Advanced: Starts at $200 per month.
The Simple Start and Essentials plans primarily include core accounting functions, with most advanced features like inventory and profitability projections available at only the higher tiers. In some cases, like payroll, these features are part of distinct add-on subscriptions that increase the monthly base cost when included.
You can get QuickBooks for 50% off for the first three months to save a little money upfront, or you can take advantage of the 30-day free trial to see if it’s the right fit for you. However, you can’t do both — it’s either the discount or the trial.
Features
Fully managed cashflow from accounts receivable to accounts payable.
Invoices and estimates, measured financial performance over time and generated reports and forecasts.
Easy handling of payroll, taxes, business bank accounts and more.
Pros
An all-in-one solution, especially for businesses that need to track physical resources.
Extensive tax support through add-ons and support from human experts.
Widely used and integrated, making it easy to implement and troubleshoot.
Cons
Many key features are part of add-ons that drive up costs.
Base cost is higher than average.
Robust platform options may be more than simpler use cases need.
Strict user limits can make scaling difficult.
For more information, read the full QuickBooks review.
FreshBooks: Best for high clientele count
Image: FreshBooks
FreshBooks offers software solutions to freelancers, solopreneurs, small businesses and organizations that rely on contractors. With tools to support accounting, invoicing, time-tracking, payroll and client communication, it offers many of the core features QuickBooks does without the added costs or tier-based limitations.
Pricing
FreshBooks has three standard pricing tiers, plus an enterprise tier:
Lite: Starts at $17 per month.
Plus: Starts at $30 per month.
Premium: Starts at $55 per month.
Select: Call for custom pricing.
The Select tier also offers a dedicated account manager, specialized features and help migrating from other accounting software.
Like QuickBooks, you can choose to have FreshBooks at 50% off for the first three months or take it for a spin with a 30-day free trial, but you can’t have both.
Features
Unlimited invoices and clients (but only for higher tiers).
Tracking for time, expenses, projects, activities and invoice status.
Payroll integration with Gusto.
Pros
Lower costs that includes equivalent features to many enterprise solutions.
Premium tier has unlimited invoices and unlimited client accounts.
Mobile app for ease and mileage tracking.
Cons
Does not include inventory tracking.
Despite lower subscription costs, Lite and Plus subscribers are still limited to 5 and 50 max clients, respectively.
Additional users cost extra.
Payment processing fees can add up, with only the enterprise tier benefiting from reductions or caps on said fees.
For more information, read our FreshBooks review.
Sage Intacct: Best for AI-powered finance management
Image: Sage
Sage is a finance platform that incorporates extensive business intelligence functionality. Its two core products, Sage Intacct and Sage X3, function as analytics-boosted versions of SMB finance and enterprise ERP, respectively. The suite also includes products for payroll, CRM, human asset management, time tracking and more.
Pricing
Sage doesn’t have transparent pricing on its site, so you’ll have to call for a quote.
Features
Designed to meet the demands of specialized industries, including construction, healthcare, hospitality, manufacturing and more.
Offers fixed asset management, Salesforce integration and both a desktop and cloud-native version of the app.
Includes some of the most advanced financial and resource analytics in the market.
Pros
Built from the ground up to support business intelligence, helping organizations make smarter, more effective financial decisions.
Customizable feature packages include HR and payroll, inventory and resource management, CRM and more.
Cons
Website doesn’t list pricing, but user reviews often cite high subscription costs.
Software is less intuitive to use and implement.
Wave: Best low-cost payroll solution
Image: Wave Accounting
Wave positions itself as a bridge between professionals just starting their business journey and growing businesses who now need a way to pay employees and contractors. Offering the use of most of its features for free, Wave only charges users for processing incoming payments and paying employees and contractors. For professionals looking to minimize costs, but needing the flexibility to include payroll functions, Wave is a solid bet.
Pricing
Invoicing and finance management: Free
Electronic payments: Costs 2.9% + $0.60 per transaction (3.4% + $0.60 for AMEX transactions) or a flat 1% fee for bank payments.
Payroll subscriptions: Costs $20 per month + $6 per employee or contractor for self-service U.S. tax states and $40 per month + $6 per employee or contractor for tax service states.
Advisor add-ons: Costs $149 per month for bookkeeping support and a one-time $379 fee for accounting and payroll coaching.
Features
Boasts accounting functions designed around free users.
Includes free finance tracking, invoicing and more.
Ability to accept payments through the platform, and only pay per transaction.
Enables payments for employees and contractors through payroll add-ons.
Pros
Ample free features.
Payment only for transaction processing and payroll.
Optional add-ons for expert accounting support.
Cons
Tax functionality limited to self-service in some U.S. states.
Bookkeeping support and accounting coaching are valuable but expensive add-ons.
For more information, read our Wave Payroll review.
Zoho Books: Best for complex, distributed teams
Image: Zoho
Zoho Books is the accounting and financial portion of the full Zoho software suite. An expansive platform built to power inventory systems, CRM efforts, email automation, human resources, IT management and more, Zoho is one of the broadest software tool sets on the market. Businesses can use Zoho Books as a standalone product or combine it with any number of other products to customize the level of functionality brands need.
Standard: Costs $15 per organization per month, billed annually.
Professional: Costs $40 per organization per month, billed annually.
Premium: Costs $60 per organization per month, billed annually.
Elite: Costs $120 per organization per month, billed annually.
Ultimate: Costs $240 per organization per month, billed annually.
Features
Designed around organizations that need to manage multiple locations, departments, teams, facilities and so on, regardless of distance.
Full integration with the extensive and expansive Zoho software suite.
Robust features available for free for business users under $50k annual revenue.
Multiple pricing tiers allow organizations to scale their subscription in step with increasing needs as the business grows.
Pros
Free tier includes all common accounting features, plus many usually reserved for paid subscribers.
All paid subscribers get access to payment gateway integrations that include nearly all major market leaders.
Subscribers can manage multiple organizations or locations while still minimizing software costs.
Cons
Limits to low user headcount, even at top tiers, with add-on users requiring a per-user fee increase.
Additional modules (like IT, HR, CRM, etc.) add to monthly subscription costs, making the full suite much more expensive.
Add-ons are not supported on the free plan.
ZipBooks: Best for solopreneurs
Source: ZipBooks
ZipBooks combines several of the advantages of the entries listed above and packages them into a free or low-cost option for the smallest of businesses. Offering unlimited invoices, vendors and customers even on the free plan, ZipBooks helps solopreneurs and small teams run their finances smarter, without having to pay hundreds a month in software fees.
Pricing
Starter: Free.
Smarter: Costs $15 per month.
Sophisticated: Costs $35 per month.
Accountant: Custom pricing.
Features
Easy-to-use solution with straightforward billing and subscription tiers.
Acceptance of digital payments through Square or PayPal.
Custom “Accountant” tier for professionals that want to extend ZipBooks functionality to their clients.
Pros
Unlimited invoices, vendors and customers for every plan.
Acceptance of digital payments for every subscription tier.
Unlimited users for top paid tiers.
Cons
Includes a shorter feature lists than most other options.
Free plan limits subscribers to a single user and a single connected bank account.
NetSuite: Best enterprise-level solution
Image: NetSuite
Just as QuickBooks is the foremost name in financial software, NetSuite has been a pioneer of cloud-based business systems since the very beginning. The full platform encompasses ERP, global business management, human capital management, omnichannel commerce and much more. Unlike other options in this list, however, NetSuite is all-or-nothing. Using any of the products requires paying for the whole platform, meaning enterprises are the best suited to this accounting solution.
Pricing
Unfortunately, you have to contact NetSuite for a quote. To get started, simply fill out a form on the NetSuite site.
Features
Complete, enterprise-wide visibility into finances, with real-time updates and robust reporting options.
Mobile functionality, making critical financial functions accessible from nearly anywhere.
Powerful tools to support large organizations in regulatory compliance.
Pros
Full-service software suite.
Customizable integration, automation and implementation.
Designed with massive, complex organizations in mind.
Cons
Includes higher cost thresholds than other available options.
Requires extensive integration and deployment, both in the digital environment and in the organization.
Setup and onboarding often takes a significant amount of time.
Is Xero worth it?
Image: Xero
Xero represents a middle ground between complex, expensive solutions and simple, affordable ones. With plans ranging from $13 per month to $70 per month, there are options to fit most small and midsize budgets while also offering room to grow. And, as a double-entry solution, it prioritizes accuracy and compliance.
Xero pricing
Early: Costs $13 per month.
Growing: Costs $37 per month.
Established: Costs $70 per month.
If you haven’t gotten Xero yet and are thinking about it, you can get 50% off your first three months.
Xero pros
Simple, affordable functionality for new businesses.
Optional payroll add-on through Gusto for every tier.
24/7 online support.
Easy implementation.
Contractless subscriptions you can cancel anytime (with one month’s notice).
Xero cons
Basic subscriptions limit users to just 20 invoices or quotes.
Only top tier subscribers benefit from multiple currency support, project tracking and claiming expenses.
Payroll add-on is an additional $40 per month.
Do you need an alternative to Xero?
Xero is a solid option for businesses as they start to get organized with their finances, but some users may find it restrictive feature-wise, especially compared to other options with similar price points. Ultimately, though, you have to decide if its features and functionality will adequately support your particular business.
Methodology
While writing this comparison article, we researched vendor websites and customer reviews on sites like Trustpilot and Gartner to fully understand the offerings and target use cases of each solution.
Motorola clearly read reviews of Samsung’s Z Flip series and took notes. The Moto Razr+, a foldable phone that’s like a standard 6.9-inch handset when open, offers a large 3.6-inch screen when closed. That addresses one of the most common complaints about the Galaxy Z Flip 4 — the size of its Cover Display. It’s a cramped 1.9-inch window with a limited selection of widgets that you can use. The Razr+, meanwhile, pretty much runs full Android with some tweaks. There’s something about using the outer display that feels almost pager-like and sent me into nostalgic delight. The Moto Razr+, which goes on sale today for $999, might appeal to both old souls and early adopters alike.
Design
Currently in its fourth generation (if you count the 5G model released in 2020 as a second-gen), the Razr+ has two notable differences from its predecessors. The first is the larger display. The second is something only people over 30 might notice: The Razr+ doesn’t have a chin cupping the bottom like on the iconic original Razr. I don’t mind it, but it does cost it some nostalgia points.
Motorola
Motorola Moto Razr+
Pros
Useful and roomy external display
Folds in half to become very compact
Can be own tripod for photos or videos
Cons
Cameras cannot compare to flagships
Long-term durability and security remains a concern
When folded, there is no gap between the two halves of the main screen. It’s a squat square, and its matte back reminds me of the case that my dad’s pager sat in. Sadly, only the Viva Magenta model comes with a vegan leather back, while the blue and black models use Corning Gorilla Glass Victus on the front and rear. Our review unit is black, and the matte finish lends a more premium feel and helps fight smudges.
The folded Razr+ is thinner than the Galaxy Z Flip 4 and fits comfortably in my palm, and it’s slightly larger than the Samsung phone when open. The Razr+ has a slightly less rigid hinge than the Flip 4, too. The Samsung phone can hold itself up at pretty much any position, but Moto’s hinge yields and opens all the way when you push it past 150 degrees.
Finally, at 188.5 grams (6.6 ounces), the Razr+ is lighter than the iPhone 14 Plus and the Galaxy S23 Plus, which both have slightly smaller screens. It’s just a tad heavier than the Z Flip 4, though. Both Motorola and Samsung’s devices are rated for water-resistance, with the Razr+ meeting IP52 standards while the Flip hit IPX8.
External display
Next to the Moto Razr+, using the Z Flip 4’s Cover Display feels unusable, especially when trying to frame a selfie. Not only is there barely enough space to contain everything, but it’s also hard to see. When shooting the video for this piece, our producer Joel Chokkattu struggled to get a usable shot of the camera preview on the Z Flip 4’s exterior display in sunlight.
Motorola’s larger pOLED panel also allows for a more full-fledged Android experience, while Samsung is a glorified notification widget. On the Moto, you can swipe down from top to see all your quick settings toggles and the brightness slider, swipe up slowly to show your open apps and switch between them, and swipe in from the side to go back. In comparison, the Z Flip 4 only lets you swipe sideways to rotate through widgets, and dragging down from top shows you just a single row of toggles.
Photo by Cherlynn Low / Cunghoctin
The main difference between Moto’s external display and the complete Android experience is the home screen. Motorola has designed it so that you can only have the clock widget, date, weather info and a row of six shortcut buttons. Tapping each of the latter takes you to the respective panel. You can also swipe sideways to see them sequentially, and you can arrange them in the order you prefer.
The widgets themselves are very similar to Samsung’s offerings. You’ll find an app launcher, dialer, calendar, games, media controls, steps tracker and the day’s headlines. On the Moto, the latter two are supplied by Google services like Fit and News. Because the Razr+ has more real estate, it can display more information or use a larger font. Both of these are an obvious improvement over Samsung’s teeny tiny panel, especially for those with bigger fingers, less dexterity or vision-related challenges.
The widgets aren’t the scene stealers here. For the most part, they’re simple – a calculator, media controls, et cetera. The Spotify playback widget doesn’t do more than let you pause, skip tracks, rewind and change playlists, which is frustrating. But even the fact that it offers that last option is already better than the Z Flip 4.
Gallery: Moto Razr+ review | 21 Photos
Gallery: Moto Razr+ review | 21 Photos
You can’t pick a specific song in a playlist, though. It’s a mild annoyance and not a dealbreaker, especially since there are two viable alternatives here. One: I can just open the phone and use the main Spotify app to go to a different playlist and pick a song. Two — and this is where the Razr+ truly shines — any Android app can run on the outside screen, as long as you’ve enabled it. This is a continuity feature so you can keep running whatever you’re doing on the main display on the outside panel after you close the phone.
To use Spotify (or any other app) on the small screen, I’d open it on the inside, shut the device, and continue outside. Even if I go on to do something else, I can find the app on the exterior display by swiping up from the bottom to see open apps.
You’d think that there would be issues with apps breaking and elements either not showing or being blocked by the two cameras on the bottom right of the screen. But Motorola has some workarounds. You can either have apps take up the whole screen and the sensors block parts of it. Or you can swipe up and select a layout that forces the content to sit within a rectangle above the cameras similar to how Android phones used to treat camera notches.
This should work with any app, but there are some scenarios where the experience is broken. When you’re navigating a drive with Google Maps and playing music at the same time, for example, you won’t be able to see the directions or your route. And, just because you can see your Instagram feed on the 3.6-inch panel, doesn’t mean you’ll want to.
Photo by Cherlynn Low / Cunghoctin
Even better, because the screen is so small (basically the size of the original iPhone), it’s easy to use with one hand. You can pull up a full QWERTY keyboard to reply to messages, and I was able to reach the letter Q or A with my thumb stretching across from the right.
Cameras
One other advantage of a larger external screen is how much more useful it is as a viewfinder. Both Samsung and Motorola let you use the outside display to preview what you’re shooting with the rear cameras, as well as show your subject what they look like. On the Z Flip 4, you can only see a portion of the scene and will have to guess where it will get cut off. With the Razr+, no guesswork is necessary – WYSIWYG.
Both phones offer similar gestures like holding up your palm to trigger a countdown till the photo is shot, so you can step away and take your picture when you’re ready and posed. You can also have the foldables bent at 90 degrees and placed on a surface with the inside screen facing out, and the layout will change so the top half is your viewfinder and the bottom shows controls.
Unfortunately, on the Z Flip 4 you have to choose between a bigger viewfinder with an inferior 10-megapixel camera or a smaller window and better cameras. On the Razr+, you can use the roomy outside screen and the exterior cameras instead of having to sacrifice quality or visibility while shooting.
Photo by Cherlynn Low / Cunghoctin
Moto opted for a 32 MP sensor inside, with a 12 MP main camera and 13 MP wide-angle system. Initially, I thought the Razr+ delivered decent shots. But after comparing them to samples from the Z Flip 4 and a Pixel 7 Pro, Motorola’s images are clearly washed out and less vivid. Samsung did a better job at exposure and retained the blue skies peeking through green leaves. In the same scene, the Razr+ blew out the sky. And when I snapped portraits of my friends’ adorable dogs, it struggled to get a clear shot due to slower focus and overall lag.
The Moto also struggled in low light and was susceptible to lens flares in my nighttime cityscapes and selfies. Though the Flip 4 fared slightly better, overall flip-style foldables lag flagship phones when it comes to camera performance.
As a regular phone: Main screen, performance and battery life
Unlike most high-end Android phones released this year, the Moto Razr+ uses a year-old Snapdragon 8 Gen 1 chip, which is the same processor inside the Z Flip 4. It’s worth pointing out at this point that the Flip 4 is also nearly a year old and presumably about to be replaced by a newer model. So if having the absolute latest specs matters to you, you shouldn’t even be considering the Razr+.
Photo by Cherlynn Low / Cunghoctin
If you’re not picky about the exact generation of processor in your phone, you’ll likely be satisfied with the Moto’s performance. I played endless rounds of Solitaire, messaged friends, set up custom gestures, changed wallpapers and it never flinched. The few hiccups I did encounter, like not being able to hit the X button at the outermost corners of an ad in a game, had more to do with specific apps and bad design than horsepower.
Thanks to its 165Hz refresh rate and 1080p resolution, the Razr+’s main OLED display is a solid canvas for activities like scrolling through Instagram and Reddit. Pictures and Stories I looked at were vibrant, and yes, there is still a bit of a crease where the screen folds, but it’s negligible. It doesn’t get in the way of actually interacting with apps or websites, and I mostly forgot it was even there.
When I needed to unlock the Razr+, it was as easy as using the fingerprint sensor embedded in the power button. Motorola also continues to offer nifty features that have been in its phones since the Moto X, like twisting your wrist or doing a chopping action while holding the handset to launch the camera or flashlight. It was also surprisingly easy to install the company’s Ready For app to use the Razr+ on my PC. While I was initially put off by the amount of Moto-branded software, thankfully most of it was useful and didn’t feel like bloatware.
Though the company promises three years of OS upgrades and four years of bi-monthly security patch updates, historically it . And that’s less than the four years of OS updates and five years for security releases that Samsung offers. That, together with Samsung’s experience in foldables, gives me slightly more confidence in its devices’ longevity.
Photo by Cherlynn Low / Cunghoctin
Moto managed to squeeze a 3,800mAh battery in the Razr+, which is slightly higher than the Flip 4’s 3,700 mAh setup. I haven’t had the time to run our video rundown battery test, which I want to do on both the 6.9-inch and 3.6-inch panels. But I’ve been able to play about five to eight hours of nonstop Solitaire on the internal screen so far before needing to plug the Razr+ in. It’s also worth noting that since the exterior display is so much more useful, you can do more on the phone without having to tap the larger, more energy-intensive screen during the day. That way, the Moto actually manages to last longer than most phones.
Wrap-up
I am in love with that front screen — how it works, how easy it is to use with one hand, and how much more power efficient it is. It’s almost like I want a small phone again. But the main thing preventing me from switching to the Moto Razr+ is camera performance. This isn’t a problem unique to Motorola — any flip-style foldable today suffers from this.
Anyone thinking of getting the Razr+ should also wait. Samsung has announced that its next Galaxy Unpacked will be taking place in Korea in late July, and it’s widely expected to launch new foldables then. If you can hold off, it’s worth seeing what the next Z Flip will offer before spending your money.
Photo by Cherlynn Low / Cunghoctin
I also want to point out that long-term durability remains a concern for any device with a flexible screen. Two of my colleagues have used a Z Flip 4 for a year and they’ve reported seeing cracks and bubbles in their displays and/or screen protectors. While the Razr+ uses a different panel from Samsung, there is still a possibility it won’t stand up to the wear and tear of daily use.
I can’t tell you how well the Moto Razr+ will hold up over time. But I can say that, for the first time in the US, there is serious competition for Samsung’s Z Flip 4. It’s time to call it: Flip Boi Summer is here and I’m excited for it.
Chúng tôi vẫn đang theo dõi thông báo chính thức của AMD về bộ tăng tốc trung tâm dữ liệu AI của họ, MI300X. Đó chắc chắn là một lực lượng xử lý cần được tính đến – một lực lượng mà AMD nhắm đến sử dụng như một chiếc dùi cui để cố gắng đánh bật Nvidia khỏi vị trí kẻ thống trị trong thế giới tăng tốc AI. Nhưng việc tăng hiệu suất đôi khi chuyển thành mức tiêu thụ năng lượng cao hơn, mặc dù mỗi kiến trúc mới thường cải thiện hiệu quả sử dụng năng lượng (tiêu thụ ít năng lượng cho cùng một đơn vị công việc). Và dựa trên OAM của AMD (Mô-đun tăng tốc OCP) – MI300X – chắc chắn là một thiết bị ngốn điện: ở mức 750 W, nó thực sự là sản phẩm có TDP được đánh giá cao nhất từng có trong hệ số hình thức của nó. Tuy nhiên, đừng lo lắng: các thông số kỹ thuật cho các giải pháp OAM lên tới 1000 W công suất có thể phân phối, do đó, vẫn còn chỗ để mở rộng hiệu suất hơn nữa.
Ẩn trong chú thích cuối trang của AMD là thước đo mức tiêu thụ điện năng của MI300X. (Nguồn: AMD qua Videocardz)
Mặc dù 750 W là lượng điện năng khổng lồ được tiêu thụ bởi bất kỳ phần cứng PC riêng lẻ nào (ít nhất là từ quan điểm của một cá nhân), chúng tôi phải lưu ý rằng những watt đó đang cung cấp năng lượng cho phần cứng nhanh hơn và chuyên dụng hơn nhiều so với ngay cả những card đồ họa mạnh nhất của AMD. Đối với công suất đó, AMD đang cung cấp thứ mà họ tuyên bố là bộ tăng tốc hiệu quả nhất cho khối lượng công việc liên quan đến AI (cả trong AI tổng quát và Mô hình ngôn ngữ lớn [LLM] xử lý).
Xem xét cách AMD quản lý để nhồi nhét 12 chiplet được xây dựng trên hai quy trình chế tạo (8x 5nm [GPU] và 4 nút 6nm [I/O die] với tổng số 153 tỷ bóng bán dẫn, tuyên bố đó có thể có một số hậu thuẫn. Tất nhiên, cũng có vấn đề là AMD đã quản lý để chạy mô hình LLM 40 tỷ tham số (Falcon 40-B) trên một MI300X duy nhất. Giờ đây, điều đó thật ấn tượng, đặc biệt khi xem xét mục tiêu của AMD là MI300X có thể mở rộng tới tám bộ gia tốc trong một gói duy nhất.
Vuốt để cuộn theo chiều ngang
AMD MI300X… và các loại khác
Hàng 0 – Ô 0
AMD MI300X
AMD MI300A
AMD MI250X
AMD RX 7900XTX
lõi CPU
0
3x CCD 8 lõi (24 lõi) [Zen 4]
–
–
lõi GPU
8x GCD (304 CU) [CDNA 3]
6x GCD (228 CU) [CDNA 3]
(220 CU) [CDNA 2]
(RDNA 3)
Bộ nhớ địa chỉ
192 GB (8x 24 GB HBM3)
128 GB (8x 16 GB HBM3)
128 GB (8x 16 GB HBM2e)
24GB GDDR5
Băng thông bộ nhớ
5,2TB/giây
5,2TB/giây
~ 3,28 TB/giây
384GB/giây
Băng thông vải vô cực
896GB/giây
896GB/giây
800 GB/giây
–
Số lượng bóng bán dẫn
153 tỷ
146 tỷ
~ 58,2 tỷ
~ 57 tỷ
TDP
750W
?
560W
355 W
Như chúng ta thấy từ bảng trên, sự tập trung của AMD vào việc tăng hiệu quả sử dụng năng lượng đã không đủ để bù đắp các yêu cầu tính toán ngày càng tăng đối với các kịch bản Điện toán hiệu năng cao (HPC), hiện bao gồm việc xử lý các mô hình LLM dường như đang phát triển trái và phải . Các yêu cầu về hiệu suất tăng lên có nghĩa là ngay cả với các công nghệ, kỹ thuật tiết kiệm năng lượng mới nhất của AMD và công nghệ chế tạo mới nhất của TSMC, vẫn cần phải tăng đường bao công suất lên 190 W.
Tuy nhiên, mức tăng TDP 190 W đó (mức tiêu thụ điện năng cao hơn khoảng 33%) tương đương với khoảng ba lần số bóng bán dẫn được cấp nguồn so với MI250X – một biểu hiện ấn tượng về mức tăng hiệu suất, ngay cả khi không tính đến khả năng hỗ trợ cải tiến của MI300X cho các thuật toán thưa thớt (cực kỳ quan trọng để xử lý LLM và AI). Điều đó không nói lên bất cứ điều gì về sự khác biệt giữa bộ tăng tốc tính toán của AMD và GPU chơi game hàng đầu của công ty, RX 7900 XTX tương đối nhỏ bé.
Một người dùng Reddit báo cáo rằng bộ nguồn BeQuiet Dark Power 13 1000W của họ đã không chịu nổi thảm họa nóng chảy 12VHPWR giống như một số chiếc RTX 4090. Người dùng đã tiết lộ hình ảnh của bộ nguồn được hỗ trợ 16 chân, cho thấy một đầu nối bị nung chảy hoàn toàn ở phía bộ nguồn. Điều này cho thấy khả năng vẫn còn những vấn đề nghiêm trọng về độ tin cậy cần được giải quyết bằng đầu nối mới.
Đầu nối 16 chân nóng chảy không phải là điều gì mới mẻ, đặc biệt là trên các card đồ họa ngốn nhiều điện hơn như RTX 4090. Tuy nhiên, việc nhìn thấy đầu nối nóng chảy trên bộ nguồn là điều gần như chưa từng xảy ra. Điều này đặc biệt đúng khi không có bộ điều hợp nào được sử dụng, vì Dark Power 13 có hỗ trợ riêng cho cáp 16 chân.
Cáp RTX 4090 12vhpwr bị cháy ở phía PSU? từ r/4090Burning
Các hình ảnh cho thấy hàng chân dưới cùng của chính đầu nối (ngay bên cạnh bốn chân ‘có ý nghĩa’) đã bị phá hủy hoàn toàn trong quá trình nóng chảy khiến chúng hầu như không thể nhận ra so với hàng chân không bị tổn thương phía trên. Tương tự như vậy, đầu nối nguồn 16 chân bên trong PSU cũng có dấu hiệu hư hỏng tương tự, làm lộ phần nhựa nóng chảy dọc theo hàng cổng dưới cùng.
Tuy nhiên, đây là một trường hợp đầu nối nguồn 16 chân bị cháy ở đầu nguồn và bạn nên cẩn thận. Nếu không có nhiều báo cáo, thì không thể nhận ra mức độ phổ biến của vấn đề hoặc liệu đây có phải là sự cố xảy ra một lần hay không.
Tuy nhiên, lặp lại một loạt các báo cáo tan chảy RTX 4090 đã xuất hiện trong năm qua. Mặc dù các báo cáo này không bao gồm hư hỏng ở đầu nguồn điện, nhưng về mặt kỹ thuật, có thể xảy ra hư hỏng giống nhau ở cả hai đầu vì đầu nối GPU và đầu nối nguồn điện giống nhau. Nếu báo cáo này là hợp pháp, nó có thể là khởi đầu của một làn sóng thảm họa 16 chân mới khi ngày càng có nhiều người tiếp tục sử dụng bộ nguồn Gen 3.
Phần cứng của Tom đã liên hệ với cả Be Silent! và Nvidia. Nhà sản xuất PSU đã không phản hồi kịp thời cho việc xuất bản, trong khi người phát ngôn của Nvidia cho biết chúng tôi có thể không nhận được phản hồi trong vài ngày do công ty đóng cửa.
Sự cố này không thể xảy ra vào thời điểm tồi tệ hơn khi vẫn có nhiều báo cáo về đầu nối 16 chân của RTX 4090 bị nóng chảy. Nvidia tuyên bố rằng tất cả các sự cố ở đầu nối 16 chân đều liên quan đến lỗi người dùng, với đầu nối không được đặt đúng vị trí. Nhưng thật khó để tin rằng tất cả các lỗi đều do lỗi của người dùng vì một số báo cáo mới nhất này đến từ những người tự nhận là nhà xây dựng hệ thống kỳ cựu.
Hy vọng rằng sự cố cấp nguồn này với đầu nối nguồn 16 chân không xảy ra với nhiều người dùng hơn. Nhưng nếu đúng như vậy, đây có thể trở thành một vấn đề thậm chí còn nghiêm trọng hơn đối với ngành công nghiệp cung cấp điện và card đồ họa.